Wednesday, October 31, 2012

Two Percent Growth Isn’t ‘New’ Normal

Popular Economics Weekly

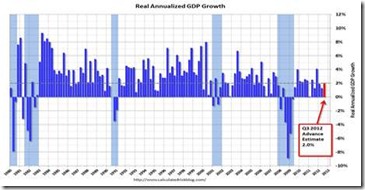
There are many ways to look at the “weak” 2 percent growth numbers for Q3, though just the ‘Advance Estimate’ and so subject to at least 2 more revisions. But such weak growth isn’t due to excessive government regulations (since deregulation has not created greater overall growth, only more recessions). The record low interest rates mean that banks and corporations have too much money to spend, but no place to invest it, since consumers aren’t spending as they used to.

Weak growth over the past decade in particular can mainly be traced to the fall in household incomes, and what consumers can really afford. If their incomes were growing as in 2000 before the Bush tax cuts and wars, for instance, then we would already be back to 1990s levels of economic growth—when 4 to 6 percent annual growth rates were more normal—before the last 2 recessions (gray bars) as the graph shows.

clip_image002

Graph: Calculated Risk

And where has the lost household income flowed, since corporations have the highest profits in history as a percentage of GDP? It has been paid to the investor class and corporate CEOs, in the form of increased dividends, capital gains and stock options, or is part of the $2 trillion cash hoard held by corporations.

clip_image004

Graph: CBPP

For it is the tremendous shift of wealth that has stunted growth since 2000 and caused the Great Recession. Incomes of the wealthiest have soared, mainly because of 2001 and 2003 tax cuts that lowered investment tax rates for the wealthiest and drastically cut tax revenues, while incomes of 99 percent barely grew. This diminished purchasing power of consumers has accounted for most of the $6 trillion in lost output that resulted from the 18-month Great Recession (12/2007 – 6/2009).

It is an example of the failure of small government policies that instead of creating more prosperity for all, diverted it to the wealthiest. And the resulting record income inequality has damaged economic growth say more and more studies, such as a recent IMF study by Andrew Berg and Jonathan D. Ostry that suggests income inequality might shorten our economic expansion by one-third in jobs lost and goods products.

“…a careful look at the varying levels of inequality in different countries demonstrates just how much societal divides in wealth really matter. Countries with high inequality are far more likely to fall into financial crisis and far less likely to sustain economic growth,” said the authors in a Foreign Affairs article.

The U.S. has fallen to the lowest ranking on income inequality. The CIA World Fact Book ranks the U.S. 94th in income equality below all developed countries, Iran, and Russia. In fact, the U.S. is just above Jamaica and the poorest African countries. Wealth—both income and assets—has become concentrated among fewer and fewer Americans, in other words.

In spite of consumers’ massive loss of income, the University of Michigan reports confidence is being restored—though nothing like the 1990s readings of 100 plus. Hence the belief that consumers are becoming resigned to a ‘new’ lower growth normal. The 88.1 reading for current conditions is up a noticeable 2.4 points from September to hint at general growth for October's slate of economic data. The expectations index is up a sizable 5.5 points from September which hints at confidence in income prospects and is a positive for the holiday shopping outlook.

clip_image006

Graph: DShort

But this new normal for lower growth is nothing like the 1990s, as we’ve said, and as the graph makes clear. Contrary to Mitt Romney’s assertion that governments don’t create jobs, we can now see the effects of FEMA’s disaster relief efforts after Tropical Storm Sandy. Governments spend most revenues in the private sector—whether for defense, education, environmental protection, infrastructure or research.

So we do not have to accept slower growth, if we recognize and right the record inequality that has caused our market economy to repeatedly crash. As Nobel Economist Joseph Stiglitz was quoted in a recent review of his latest book, The Price of Inequality, “Inequality leads to lower growth and less efficiency. Lack of opportunity means that its most valuable asset — its people — is not being fully used. Many at the bottom, or even in the middle, are not living up to their potential, because the rich, needing few public services and worried that a strong government might redistribute income, use their political influence to cut taxes and curtail government spending. This leads to underinvestment in infrastructure, education and technology, impeding the engines of growth… “

Harlan Green © 2012

Monday, October 29, 2012

U.S. Economy Is In Recovery

Popular Economics Weekly

I mentioned last week that the U.S. economy is now growing faster than the rest of the developed world. How can that be, you say, with all the election propaganda saying the recovery has been a failure?  Here’s why.  The IMF has now chimed in to the chorus of voices that says the U.S. is the first to repair the destruction wrought by the Great Recession. 

The International Monetary Fund’s latest World Economic Outlook projects that the United States will be the strongest of the world’s rich economies. U.S. growth is forecast to average 3 percent, much stronger than that of Germany or France (1.2 percent) or even Canada (2.3 percent).

“Increasingly, the evidence suggests that the United States has come out of the financial crisis of 2008 in better shape than its peers — because of the actions of its government,” says Fareed Zakaria in a Washington Post Oped. “In addition to providing general liquidity, the Fed and the Treasury rescued the financial system but also forced it, through stress tests and new rules, to reform. The result is that U.S. banks are in much better shape than their European counterparts.”

And the Fed announced it will discuss a possible expansion of the size of its third round of bond buying and “better ways to guide markets about future policy actions” at its last FOMC meeting.  This includes setting actual employment targets to reduce the unemployment rate to 6 percent or below.  This is huge, and markets rallied on the announcement because there is no other stimulus spending in the works with austerity in Europe and even China slowing. 

One major issue that hasn’t been discussed is debt deleveraging, and the U.S. is outperforming other developed—and underdeveloped—countries in reducing its debt, contrary to the contentions of politicians who have been repeating their charge that Obama is making the deficit worse, though most of it came from the Great Recession.

clip_image002

Graph: McKinsey and Company

Also, a McKinsey and Company study noted that “Debt in the financial sector relative to GDP has fallen back to levels last seen in 2000, before the credit bubble. U.S. households have reduced their debt relative to disposable income by 15 percentage points, more than in any other country; at this rate, they could reach sustainable debt levels in two years or so.”

Then U.S. corporations have bounced back. Corporate profits are at an all-time high as a percentage of Gross Domestic Product, and companies have $1.7 trillion in cash on their balance sheets. The key to long-term recoveries from recessions is reform and restructuring, and U.S. businesses have responded with government help.

And there is America’s energy revolution, which is also bringing back manufacturing. U.S. exports, which have climbed 45 percent in the past four years, are at their highest level ever as a percentage of GDP.

The facts speak for themselves, in spite of the ‘fiscal cliff’ scares, and most of the euro zone in recession.  The best way to weather any future downturn is to have paid down their debts.  So it looks like the U.S. will once again be the world’s engine of growth that prevents another recession, as I’ve said.

Harlan Green © 2012

Thursday, October 25, 2012

New-Home Sales, Mortgages Boosting Growth

The Mortgage Corner

Following the 15 percent housing construction bump in September, new-home sales rose 11.7 percent and are up 27 percent over September 2011, as inventories have shrunk to a meager 4.5 months, especially at the affordable level. The Census Bureau reports New Home Sales in September were at a seasonally adjusted annual rate (SAAR) of 389 thousand. This was up from a revised 368 thousand SAAR in August. This is the highest level since April 2010 and the tax credit related bounce, says Calculated Risk.

clip_image002

Graph: Calculated Risk

The Mortgage Bankers Association (MBA) also expects to see $1.3 trillion in mortgage originations during 2013, largely driven by a spillover of refinances into the first half of the year. This is thanks in large part to the Fed’s QE3 that has pushed 30-year fixed conforming rates to 3.125 percent with 0 points in California at this writing.

The MBA also upwardly revised its estimate of originations for 2012 to $1.7 trillion, approaching levels at the height of the housing boom. MBA expects to see purchase originations climb to $585 billion in 2013, up from a revised estimate of $503 billion for 2012. In contrast, refinances are expected to fall to $785 billion in 2013, down from a revised estimate of $1.2 trillion in 2012, as more new homes are built.

clip_image004

Graph: Calculated Risk

“We expected 2012 originations to be front-loaded in the first half of the year, with refis falling off with rate increases, said Jay Brinkmann, MBA’s Chief Economist. “Instead we saw the refinance market grow during the year due to a combination of low rates, thanks to QE3 and slowing global growth because of continuing problems in Europe, and adjustments in the HARP and FHA refinance programs. We expect 2013 refinance originations to play out like our original expectations for 2012, with a long tail of refis extending through the first half of the year followed by a rapid drop-off in the second half.”

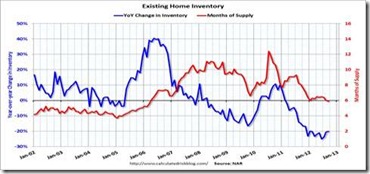
The bottom line is that with banks still holding some 2 million plus of the so-called ‘shadow inventory’ of existing homes, as they work through their homes in default, the demand for new homes should continue to grow. Serious delinquencies, which are the main driver of the shadow inventory, declined the most from April 2012 to July 2012 in Arizona (3.2 percent), Pennsylvania (2.8 percent), New Jersey (2.3 percent), Delaware (2.2 percent) and Maine (2.2 percent).

In the end, an improving jobs picture will be most effective in bringing down serious delinquencies, and so the shadow inventories further—thus increasing the supply of houses available for sale. And employment is improving with 150,000 private sector jobs per month created just over the past year, enough to absorb new entrants.

Harlan Green © 2012
Tuesday, October 23, 2012

Better Growth and Jobs Ahead?

Popular Economics Weekly

The U.S. economy is now growing faster than the rest of the world. And the Fed just announced it will discuss a possible expansion of the size of its third round of bond buying and “better ways to guide markets about future policy actions” at this Wednesday’s FOMC meeting.

This is huge, and markets rallied on Monday’s announcement prior to the meeting because there is no other stimulus spending in the works with austerity causing recessions in Europe and even China slowing. So it looks like the U.S. will once again be the world’s engine of growth that prevents another worldwide recession.

Even Barron’s is sounding upbeat on future growth—at least according to the Levy Forecast. The U.S. is “improving its manufacturing, competitiveness, containing its depression, cleaning up private balance sheets, developing greater energy independence. (read abundant natural gas)…Furthermore, the people and government of the U.S. have withstood all kinds of military, political, and economic challenges without collapsing or losing their free markets or culture of innovations.”

In the case of the Fed, words can mean as much as actions, since no one wants to bet against our Federal Reserve—and by proxy the U.S. Dollar as the world’s preeminent reserve currency.

The biggest monetary-policy development since the last Fed meeting was that Narayana Kocherlakota, president of the Minneapolis Fed, also came out in support of more accommodative numerical targets. In what one Fed watcher called a plot twist out of an Alfred Hitchcock movie, Kocherlakota called on the Fed to hold interest rates at zero for another four years until the unemployment rate hits 5.5 percent. Only a few months earlier, Kocherlakota, a leading inflation hawk, had advocated a rate hike before the end of this year.

Two signs of greater growth ahead were boosts in retail sales and the Conference Board’s Index of Leading Economic Indicators (LEI). Housing prices are also rising again as inventory shortages are slowing sales.

clip_image002

Graph: Econoday

The consumer was out spending more than expected in September—even after discounting gasoline prices.  Apple also appears to have bumped the numbers up.  Total retail sales in September advanced 1.1 percent after gaining 1.2 percent the month before.  Motor vehicle sales increased 1.3 percent after a 1.8 percent jump in August.

The best known predictor of future growth is the LEI, and the Conference Board’s index of leading indicators jumped in September but with help in August from a downward revision. The leading index increased 0.6 percent in September, following a 0.4 percent decline the prior month—originally down 0.1 percent.

clip_image004

Graph: Econoday

And though existing-home sales are slowing because of falling inventories, the national median existing-home price for all housing types was $183,900 in September, up 11.3 percent from a year ago. The last time there were seven consecutive monthly year-over-year increases was from November 2005 to May 2006, according to the NAR.

clip_image006

Graph: Calculated Risk

The Fed has made what amounts to a promise to not only keep interest rates low for years—maybe up to 4 years, if Fed Governor Kocherlakota is to be believed—until the unemployment rates drop substantially. This is a promise that not only the U.S., but the whole world will listen to given the Fed’s preeminence in supporting growth.

Harlan Green © 2012
Monday, October 22, 2012

President Obama’s Record Achievements

Financial FAQs

Why so many doubters of the President’s record? Candidate Romney would have us believe Obama has accomplished nothing, but in fact President Obama has one of the most history making legislative records since FDR. The Washington Monthly lists just 50 of President Obama’s top accomplishments.

We could start with Obama Care, or the Affordable Care Act, which no other President was able to enact, or ARRA, the $787 Billion stimulus that funded $100B in infrastructure improvements alone and supported state public service employment (police, fire, etc.), or doubling fuel efficiency of autos, or cutting nuclear weapon inventories of Russia and the U.S,, or passage of Dodd-Frank financial regulation, and so on.

In fact, he has scored successes in almost every sector of our society—universal health care, nuclear disarmament, energy conservation, education, financial regulation, consumer protection, job creation, and even housing—in spite of the record number of Senate Republican filibusters.

But more importantly, Obama has in fact reversed the Greatest Recession since the Great Depression with his economic policies and job creation programs. Yes, his so-called ‘Keynesian’ stimulus programs include recapitalizing banks, and a structured bankruptcy that brought back Chrysler and GM, thus saving 1 million jobs. And ARRA is credited with saving up to 3.5 million jobs, by the way.

This won’t satisfy Romney-Ryan supporters, of course, who believe only way to prosperity is to reduce taxation of the wealthiest. But it has never worked. GW Bush’s tax cuts and borrowed money created just 3 million jobs in his 8 years, versus 5 plus million jobs under Obama to date.

And it can’t work. Why? The wealthiest have for the most part hoarded their wealth; first paying themselves, then parking much of it overseas in tax havens, or investing in other countries. They have been increasing their share of our economic pie since the 1970s, creating the greatest inequality of income and opportunity since 1928.

Chrystia Freeland’s history of the wealthiest, Plutarchs, The Rise of the New Global Super-Rich and The Fall of Everyone Else, documents just how wealthy the wealthiest have become at the expense of everyone else, as she says. Just in the first year 2009-2010 of this economic recovery, for instance, 93 percent of income gains went to the top 1 percent while the top 0.01 percent gained an average $4.2 million per household.

And now we know inequality is bad for growth and our position in the world. A recent IMF study by Andrew Berg and Jonathan D. Ostry suggests such inequality might shorten our economic expansion by one-third in jobs lost and goods products.

“…a careful look at the varying levels of inequality in different countries demonstrates just how much societal divides in wealth really matter. Countries with high inequality are far more likely to fall into financial crisis and far less likely to sustain economic growth,” said the authors in a Foreign Affairs article.

clip_image004

Graph: CBPP

We actually know more than that. British sociologist Richard Wilkinson has studied inequality and written extensively about it. Countries with the greater inequality have higher rates of poverty, violence (30,000 gun deaths per year in U.S., 1 million over the last 4 decades), prisons per capita, and lower levels of health and education.

So in fact, inequality is more a symptom of third world status than being world’s superpower. In The Spirit Level, he and Kate Pickett document the damage that inequality brings to societies.

clip_image006

Graph: Spirit Level

In the case of the U.S., it will mean a decline from being the world’s only super power, as the Plutocrats garner ever more wealth for themselves, and less for the benefit of a stronger democracy. It is a sad story. Only investments in healthcare, education, Research and Development in new technologies that Obama advocates will strengthen our democracy.

Harlan Green © 2012
President Obama’s Record Achievements

Financial FAQs

Why so many doubters of the President’s record? Candidate Romney would have us believe Obama has accomplished nothing, but in fact President Obama has one of the most history making legislative records since FDR. The Washington Monthly lists just 50 of President Obama’s top accomplishments.

We could start with Obama Care, or the Affordable Care Act, which no other President was able to enact, or ARRA, the $787 Billion stimulus that funded $100B in infrastructure improvements alone and supported state public service employment (police, fire, etc.), or doubling fuel efficiency of autos, or cutting nuclear weapon inventories of Russia and the U.S,, or passage of Dodd-Frank financial regulation, and so on.

In fact, he has scored successes in almost every sector of our society—universal health care, nuclear disarmament, energy conservation, education, financial regulation, consumer protection, job creation, and even housing—in spite of the record number of Senate Republican filibusters.

But more importantly, Obama has in fact reversed the Greatest Recession since the Great Depression with his economic policies and job creation programs. Yes, his so-called ‘Keynesian’ stimulus programs include recapitalizing banks, and a structured bankruptcy that brought back Chrysler and GM, thus saving 1 million jobs. And ARRA is credited with saving up to 3.5 million jobs, by the way.

clip_image002

Graph: Calculated Risk

This won’t satisfy Romney-Ryan supporters, of course, who believe only way to prosperity is to reduce taxation of the wealthiest. But it has never worked. GW Bush’s tax cuts and borrowed money created just 3 million jobs in his 8 years, versus 5 plus million jobs under Obama to date.

And it can’t work. Why? The wealthiest have for the most part hoarded their wealth; first paying themselves, then parking much of it overseas in tax havens, or investing in other countries. They have been increasing their share of our economic pie since the 1970s, creating the greatest inequality of income and opportunity since 1928.

Chrystia Freeland’s history of the wealthiest, Plutarchs, The Rise of the New Global Super-Rich and The Fall of Everyone Else, documents just how wealthy the wealthiest have become at the expense of everyone else, as she says. Just in the first year 2009-2010 of this economic recovery, for instance, 93 percent of income gains went to the top 1 percent while the top 0.01 percent gained an average $4.2 million per household.

And now we know inequality is bad for growth and our position in the world. A recent IMF study by Andrew Berg and Jonathan D. Ostry suggests such inequality might shorten our economic expansion by one-third in jobs lost and goods products.

“…a careful look at the varying levels of inequality in different countries demonstrates just how much societal divides in wealth really matter. Countries with high inequality are far more likely to fall into financial crisis and far less likely to sustain economic growth,” said the authors in a Foreign Affairs article.

clip_image004

Graph: CBPP

We actually know more than that. British sociologist Richard Wilkinson has studied inequality and written extensively about it. Countries with the greater inequality have higher rates of poverty, violence (30,000 gun deaths per year in U.S., 1 million over the last 4 decades), prisons per capita, and lower levels of health and education.

So in fact, inequality is more a symptom of third world status than being world’s superpower. In The Spirit Level, he and Kate Pickett document the damage that inequality brings to societies.

clip_image006

Graph: Spirit Level

In the case of the U.S., it will mean a decline from being the world’s only super power, as the Plutocrats garner ever more wealth for themselves, and less for the benefit of a stronger democracy. It is a sad story. Only investments in healthcare, education, Research and Development in new technologies that Obama advocates will strengthen our democracy.

Harlan Green © 2012

Thursday, October 18, 2012

Housing Construction, Retail Sales Surge

The Mortgage Corner

Another sign that the economy is finally recovering—new housing starts surged 15 percent, to their highest levels since 2008 and the beginning of the Great Recession. This is boosting construction employment in particular, but also finance, insurance and other related sectors. Construction employment is up 7 percent just this year, for instance.

And privately-owned housing building permits in September were at a seasonally adjusted annual rate of 894,000. This is 11.6 percent above the revised August rate of 801,000 and a huge 45.1 percent above the September 2011 estimate of 616,000. This is an even better indicator that new housing inventories, which have fallen to a 4-month low, will recover.

As Calculated Risk reported, Three-fourths of the way through 2012, single family starts are on pace for about 520 thousand this year, and total starts are on pace for about 750 thousand. That is actually an increase of about 20 percent from 2011, and confirms rising builder optimism in the NAHB sentiment survey.

image

Graph: Calculated Risk

And The Federal Housing Finance Agency (FHFA) just released its August Refinance Report, which shows that Fannie Mae and Freddie Mac loans refinanced through the Home Affordable Refinance Program (HARP) accounted for nearly one-quarter of all refinances in August.

Nearly 99,000 homeowners refinanced their mortgage in August through the HARP program with more than 618,000 loans refinanced since the beginning of this year. This continues the strong pace of HARP refinancing with the program on target to reach a million borrowers in 2012.

In August, borrowers with loan-to-value (LTV) ratios greater than 105 percent continued to account for more than half the volume of HARP loans as HARP enhancements were fully implemented in the second quarter of 2012.
In August, nearly 18 percent of HARP refinances for underwater borrowers were for shorter-term 15- and 20-year mortgages, which help build equity faster.

But the best sign that consumers are feeling more confident was the surge in retail sales, up a huge 1.1 percent.

image

Graph: Inside Debt

Retail sales rose in September as Americans stepped up purchases of everything from cars to electronics, a sign that consumer spending is driving faster economic growth. Reuters’ Inside Debt reports consumer spending remains the U.S. economy's biggest engine, and expectations for third-quarter economic growth improved after the Commerce Department reported a 1.1 percent increase in retail sales.

Lastly, three and a half years after peaking, the number of California homes entering the foreclosure process fell last quarter to the lowest level since the early stages of the housing bust. Mortgage default filings hit their lowest point since first-quarter 2007, due in large part to a stronger economy and housing market and more short sales, a real estate information service reported.

All of these factors—especially consumer spending--are the reasons economists are upgrading their estimates of GDP growth for the rest of the year. 

Harlan Green © 2012

Monday, October 15, 2012

Romney-Ryan Austerity Leaves Out 47 Percent

Popular Economics Weekly

It should be obvious by now that the Romney-Ryan program of fiscal austerity—cutting government spending, while cutting taxes in the hope businesses and their investors will invest more of their wealth—can’t work. Latest evidence is the just out IMF 2012 World Economic Outlook (WEO) report that confirms European austerity policies over the past year have made things worse.

So how can Romney say he will create 12 million jobs during his tenure by cutting government spending while lowering taxes? He has said his blueprint is Paul Ryan’s House passed budget bill that drastically downsizes safety net programs, and cuts some $5 trillion in taxes over 10 years, without specifying where he will raise additional revenues to pay for those tax cuts. Since no expert believes it can be done without removing such favored tax shelters as the home mortgage interest deduction, it will create the same austerity trap Europeans now find themselves in.

For instance, we know from the IMF study Great Britain has fallen back into recession over the past 3 quarters by explicitly following Conservative PM Cameron’s austerity program. Ireland and Greece are also in recession because of draconian spending cuts, with Italy and Spain soon to follow.

Chapter One of the WEO report stated that current European policies that demand a reduction of debt as the path to recovery without job creation programs were wrong. In fact, “…IMF staff research suggests that fiscal cutbacks had larger than-expected negative short-term multiplier effects on output, which may explain part of the growth shortfalls,” said the report.

This only confirms what Keynesian economists such as Paul Krugman have been saying for years. The only path to increasing economic growth is to literally create more jobs. Only then will there be sufficient revenues to grow the economy and thereby reduce debts, both in the private and public sectors.

As Lord Keynes famously said, jobs can be digging ditches and then filling them up again, or, how about repairing some of the $2 trillion in needed U.S. infrastructure repairs being put off, which will only increase their costs? Roosevelt’s New Deal created WPA projects that grew the economy by putting people back to work—such as building Hoover Dam, planting trees and the like.

The reason austerity has been ruling economic policies of late is bond vigilantes have been in control, a relic of Germany’s fears of a repeat of their 1920s inflation rate, and U.S. creditors’ fears of inflation that eats away at bond prices. Republican conservatives have used this argument to demand lower taxes, though it has done nothing to reduce government debt. Republican Presidents Reagan and GW Bush created the largest budget deficits since World War II, as I have said.

In fact, other studies, such as by acknowledged budget experts Peter Diamond and Emanuel Saez, conclude that “the revenue-maximizing top federal marginal income tax rate would be in or near the range of 50-70 percent (taking into account that individuals face additional taxes from Medicare and state and local taxes). Thus we conclude that raising the top tax rate is very likely to result in revenue increases at least until we reach the 50 percent rate that held during the first Reagan administration, and possibly until the 70% rate of the 1970s”.

And does it significantly lower economic growth? In the postwar U.S., higher top tax rates tend to go with higher economic growth—not lower, said the study. Indeed, according to the U.S. Department of Commerce's Bureau of Economic Analysis, GDP annual growth per capita (to adjust for population growth) averaged 1.68 percent between 1980 and 2010 when top tax rates were relatively low, while growth averaged 2.23 percent between 1950 and 1980 when top tax rates were at or above 70 percent.

Neither does international evidence support a case for lower growth from higher top taxes, say Diamond and Saez. “There is no clear correlation between economic growth since the 1970s and top tax-rate cuts across Organization for Economic Cooperation and Development countries.”

It is only recently that historical evidence has been able to examine so-called supply-side economic theory that says lowering taxes promotes growth, which it turns out is just a theory not borne out by the facts.

Harlan Green © 2012

Saturday, October 13, 2012

Consumers Back on Track?

Financial FAQs

The one sector of the economy that can revive growth—consumers—look to finally believe the Great Recession is over. Consumer sentiment unexpectedly rose to its highest in five years in October as consumers became more optimistic about the economy in a possible boost to President Obama's reelection hopes, said Thomson Reuters Inside Debt Blog.

clip_image002

Graph: Inside Debt

The Thomson Reuters/University of Michigan's preliminary October reading on the overall index on consumer sentiment came in at 83.1, up from 78.3 the month before, and the highest since September 2007, the survey showed.

There are several reasons for their revival—the first being the drop to a 7.8 percent unemployment rate, with both hours worked and salaries rising. Consumers felt better about the economy in both the long and the short term, the compilers of the Thomson Reuters/University of Michigan survey said. The survey's gauge of consumer expectations jumped to 79.5 from 73.5, well above an expected reading of 74. The survey's barometer of current economic conditions rose to 88.6 from 85.7 and was above a forecast of 86.

clip_image004

Graph: Econoday

Weekly initial jobless claims also plunged, a sign that employment should continue to improve. Claims fell to 339,000 in the October 6 week for a 30,000 decline that's the biggest since July. The 339,000 level is the best reading of the recovery, said Econoday. The four-week average is down 11,500 to 364,000 and is now trending more than 10,000 below the month-ago comparison in what points to improvement for both payroll growth and the unemployment rate.

clip_image006

Graph: Econoday

Lastly, September’s unemployment report showed rising incomes. Average hourly earnings growth improved to 0.3 percent in September, following no change in August.  Analysts forecast a 0.2 percent rise.  The average workweek nudged up to 34.5 hours in September from 34.4 hours in August.  Expectations were for 34.4 hours.

And, the latest payroll data includes semi-annual benchmark revisions, as we have said. According to more complete data, payrolls were reportedly undercounted by 386,000 over the April 2011 through March 2012 period, resulting in an average 32,000 higher gain per month than earlier estimated.

So we know why consumers are feeling more confident about their future prospects, a merrier holiday season, and an improving economy. They power 70 percent of all domestic (GDP) activity.

Harlan Green © 2012
Wednesday, October 10, 2012

Shadow Housing Inventory, Foreclosures Fall

The Mortgage Corner

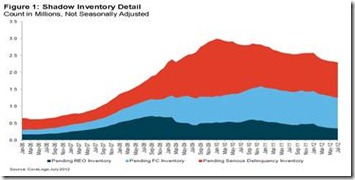
CoreLogic reported the current residential shadow inventory as of July 2012 fell to 2.3 million units, representing a supply of six months. This was a 10.2 percent drop from July 2011, when shadow inventory stood at 2.6 million units, which is approximately the same level the country was experiencing in March 2009. Currently, the flow of new seriously delinquent (90 days or more) loans into the shadow inventory has been roughly offset by the equal volume of distressed (short and real estateclip_image002 owned) sales.

“The decline in shadow inventory has recently moderated reflecting the lower outflow of distressed sales over the past year,” said Mark Fleming, chief economist for CoreLogic. “While a lower outflow of distressed sales helps alleviate downward home price pressure, long foreclosure timelines in some parts of the country causes these pools of shadow inventory to remain in limbo for an extended period of time.”

Data Highlights as of July 2012:

  • As of July 2012, shadow inventory fell to 2.3 million units or six-months’ supply and represented just over three-fourths of the 2.7 million properties currently seriously delinquent, in foreclosure or in REO.
  • Of the 2.3 million properties currently in the shadow inventory, 1 million units are seriously delinquent (2.9 months’ supply), 900,000 are in some stage of foreclosure (2.5-months’ supply) and 345,000 are already in REO (1.0-months’ supply).
  • The dollar volume of shadow inventory was $382 billion as of July 2012, down from $397 billion a year ago and $385 billion last month.
  • Serious delinquencies, which are the main driver of the shadow inventory, declined the most from April 2012 to July 2012 in Arizona (3.2 percent), Pennsylvania (2.8 percent), New Jersey (2.3 percent), Delaware (2.2 percent) and Maine (2.2 percent).
  • As of July 2012, Florida, California, Illinois, New York and New Jersey make up 45 percent of all distressed properties in the country.

clip_image004

Graph: Calculated Risk (1/06-7/12)

CoreLogic also released its latest National Foreclosure Report which provides monthly data on completed foreclosures, foreclosure inventory and 90+ delinquency rates.

  • The five states with the highest number of completed foreclosures for the 12 months ending in August 2012 were: California (110,000), Florida (92,000), Michigan (62,000), Texas (58,000) and Georgia (55,000). These five states account for 48.1 percent of all completed foreclosures nationally.
  • The five states with the lowest number of completed foreclosures for the 12 months ending in August 2012 were: South Dakota (25), District of Columbia (113), Hawaii (435), North Dakota (564) and Maine (612).
  • The five states with the highest foreclosure inventory as a percentage of all mortgaged homes were: Florida (11.0 percent), New Jersey (6.5 percent), New York (5.2 percent), Illinois (4.8 percent) and Nevada (4.6 percent).
  • The five states with the lowest foreclosure inventory as a percentage of all mortgaged homes were: Wyoming (0.5 percent), Alaska (0.8 percent), North Dakota (0.8 percent), Nebraska (0.9 percent) and South Dakota (1.1 percent).

clip_image006

Graph: Calculated Risk

Corelogic said that home prices nationwide, including distressed sales, increased on a year-over-year basis by 4.6 percent in August 2012 compared to August 2011. This change represents the biggest year-over-year increase since July 2006. On a month-over-month basis, including distressed sales, home prices increased by 0.3 percent in August 2012 compared to July 2012.

So we see the Federal Reserve’s commitment to keep interest rates at historic lows for as long as it takes to revive the housing market, and bring down the unemployment rate to more acceptable levels, is already showing results.

Harlan Green © 2012

Monday, October 8, 2012

Consumers In Holiday Mood

Popular Economics Weekly

Consumers are going to celebrate the holidays in a much bigger way than in recent years. Not only have consumer confidence and expectations been rising since summer, but consumer borrowing is exploding, signaling that we will see a surge in holiday spending. This is what will ultimately boost both employment and gross domestic product growth, which fell to 1.3 percent in Q2.

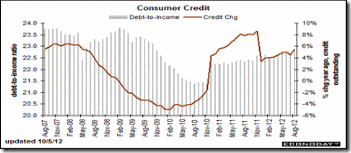
For instance, another big jump in student loans drove consumer credit higher in August, up $18.1 billion split between a $13.9 billion rise for non-revolving credit and a $4.2 billion rise for revolving credit. Non-revolving credit shows across the board gains reflecting that month's very strong vehicle sales but mostly a surge in the federal government component which is where Sallie Mae student loans are classified. Even the gain in revolving credit is solid and confirms the rise underway in consumer confidence, to fund credit card purchases.

clip_image002

Graph: Econoday

Even better news was that the September unemployment rate fell to 7.8 percent, mainly because 873,000 more found jobs in the Household Survey that includes the self-employed.

clip_image004

Graph: Calculated Risk

And, total nonfarm payroll employment for July was revised upward from +141,000 to +181,000, and the change for August was revised from +96,000 to +142,000. Employment growth has now averaged 146,000 per month in 2012, vs. 153,000 in 2011.

So how severe was the Great Recession, as compared with the rest of the world? Calculated Risk brought up Harvard Economists Kenneth Rogoff and Carmen Reinhart’s study that showed the seven most severe downturns in modern history. Finland seems to have fared the worst in 1991 with job growth not restored for 17 years, whereas our 1929 Great Depression took 10 years to recover.

clip_image006

Graph: Oregon.gov

So looked at from that point of view, the Great Recession is barely a blip on the world screen in terms of the percentage of unemployed, but it could last a total of 7 years, according to most economists (to 2014) before the employment deficit is made up.

Harlan Green © 2012

Thursday, October 4, 2012

Foreclosures Down, Mortgage Activity Surging

The Mortgage Corner

The Mortgage Bankers Association reported that its Refinance Index increased 20 percent from the previous week. This was the highest Refinance Index recorded in the survey since April of 2009. The seasonally adjusted Purchase Index increased 4 percent from one week earlier. This is while foreclosure rates continue to drop according to Lenders Processing Services (LPS).

“Refinance application volume jumped to the highest level in more than three years last week as each of the five mortgage rates in MBA's survey dropped to new record lows in the survey,” said Mike Fratantoni, MBA’s Vice President of Research and Economics. “Financial markets continue to adjust to QE3, as the ongoing presence of the Federal Reserve as a significant buyer of mortgage-backed securities applies downward pressure on rates."

clip_image002

Graph: Calculated Risk

The Federal Reserve has just initiated its QE3 quantitative easing program to mainly buy mortgage-backed securities on the open market, which is driving mortgage rates to lower record lows. In California, the 30-year conforming fixed rate has dropped to 3.125 percent with 0 origination points, for instance, while the 30-year jumbo conforming fixed is at 3.375 percent for 0 points origination. Zero cost loans are approximately one quarter percent higher to take into account escrow/title closing costs.

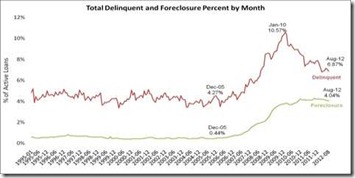
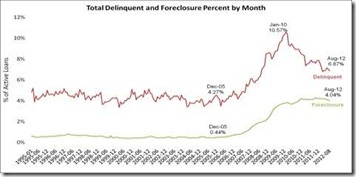
LPS reported that 4.04 percent of mortgages were in the foreclosure process, down slightly from 4.08 percent in July, and down from 4.12 percent in August 2011.

This gives a total of 10.91 percent delinquent or in foreclosure. It breaks down as:
• 1,910,000 properties that are 30 or more days, and less than 90 days past due, but not in foreclosure.
• 1,520,000 properties that are 90 or more days delinquent, but not in foreclosure.
• 2,020,000 loans in foreclosure process.
For a total of ​​5,450,000 loans delinquent or in foreclosure in August. This is down from 5,562,000 last month, and down from 6,080,000 in August 201, according to Calculated Risk.

clip_image004

Graph: Calculated Risk

We are also seeing overall economic activity accelerating. The ISM manufacturing index saw a huge boost after 3 down months to a 51.5 percent reading for manufacturing activity. And the September ISM Non-manufacturing index just reported in at 55.1 percent, up from 53.7 percent in August, thought the employment index decreased in September to 51.1 percent, down from 53.8 percent in August. Note: Above 50 indicates expansion, below 50 contraction.

clip_image006

Graph: Calculated Risk

It should be noted that Wrightson-Icap reported the increase was accounted for by a 4.3-point rise in the subjective business activity index and by a four-point jump in the new orders component, leaving both of those measures at their highest levels since last winter. The gain in the subjective index is somewhat surprising in view of the uncertainty associated with the impending fiscal cliff, which so far does not appear to be weighing heavily on sentiment.

This should not be surprising as the so-called “confidence fairies” have been saying for years now that the budget deficit would cause interest rates to skyrocket, when instead they have fallen to record lows. Why? The high unemployment rate has kept consumers, who power 70 percent of economic activity, from consuming more. Hence the Fed’s QE3 program, which is specifically designed to not only revive housing, but put more people back to work.

So we see the Federal Reserve’s commitment to keep interest rates at historic lows for as long as it takes is already taking effect with even lower record interest rates. Fed Chairman Bernanke has even stated he wants to bring the unemployment rate down to more acceptable levels, such as 6 percent. This will not be easy, but with the housing market reviving, the Fed’s job will be easier.

Harlan Green © 2012

Tuesday, October 2, 2012

Jobs Picture Much Better Than Forecast

Popular Economics Weekly

The Bureau of Labor Statistics gave markets a shot of good news recently, when it revised the one year March-to-March 2012 jobs totals upward by 32,000 per month. This was huge and showed much better jobs growth than initially forecast by the Labor Dept., with the private sector providing 453,000 additional jobs March-to-March Q1, and a 386,000 net total with government job losses included. We have to wait until this Friday to know if September’s unemployment report more accurately reflects the current unemployment picture.

clip_image002

Graph: Calculated Risk

In fact, we may be seeing the BLS under estimating job formation again this year, as Q2 job growth was less, but all indicators are that it will improve this fall. For instance, weekly initial jobless claims fell a very sharp 26,000 to 359,000 in the week of Sept. 22, while consumers are spending more going into the holidays and the latest manufacturing report was very positive with increased hiring. The largest upward revisions were in Trade, Transportation, and Utilities, followed by Construction, Leisure and Hospitality jobs.

The ISM manufacturing index saw a huge boost after 3 down months to a 51.5 percent reading for manufacturing activity.

clip_image004

Graph: Econoday

Details back the optimism with new orders, at 52.3, showing solid growth. Employment is the big plus in the September report, rising 3.1 points to a 54.7 level that indicates a surprisingly brisk pace of hiring. Negatives include a fourth month of contraction for new export orders, which reflects weak global markets, and a sixth straight contraction in total backlog orders.

Another sign of improving jobs picture was the jump in consumer optimism. The Conference Board’s consumer confidence index showed the consumer mood improved in September, jumping a very strong nine points to 70.3. This was the best reading since February and the third best reading of the whole recovery, said Econoday.

clip_image006

This report stressed the consumer's improved assessment of the jobs market. Those saying jobs are currently hard to get fell seven tenths to 39.9 percent, which is the best reading since April. Those saying that jobs are plentiful rose, up 1.1 percentage points to a still however very modest 8.3 percent. Backing up these current readings was strength in the consumer's outlook for the jobs market where more see more jobs ahead and substantially fewer see fewer jobs.

So we have reason to believe both jobs and economic growth will accelerate in the coming months. Then there is the Federal Reserve’s commitment to keep interest rates at historic lows for as long as it takes to bring the unemployment rate down to more acceptable levels, such as 6 percent. This will not be easy, with Bernanke warning that the deadlocked Congress needs to provide some fiscal stimulus as well. We know austerity doesn’t work from the European example.

Harlan Green © 2012

Monday, October 1, 2012

Romney’s 47 Percent Solution

Popular Economics Weekly

We know that Mitt Romney at a Florida fundraiser claimed that there are 47 percent of the people who will vote for President Obama no matter what, and "my job is not to worry about those people. I'll never convince them they should take personal responsibility and care for their lives," quoted Mother Jones Magazine in the news coup of the year.

But really, why isn't he worried about them? Because due to record income inequality, age, the recession, or disabilities, they have the least amount of wealth, and we know he is really about continuing to redistribute the wealth upward since the advent of government-is-the-problem, trickle-down economics of President Reagan.

As the Center for Budget Policy and Priorities has said: "Given all the talk about who does or doesn't pay federal income taxes and what this means for tax policy, here are a few basic facts.

• The vast majority (83 percent) of households who owe no federal income taxes are either working households that pay payroll taxes (61 percent) or elderly (22 percent).

• The remaining 17 percent of those who don't pay federal income taxes are mostly those who are not working due to illness or disability, or are in school.

His program, which I call the '47 percent solution,' will in fact further impoverish the 47 per cent who don't pay federal income taxes by continuing to cut back on the federal safety net of social security and Medicare. It does so by adhering to the Republican Party Platform, a combination of his 5-Point Plan and that of Veep candidate Paul Ryan, which is the only Republican budget plan with any detail that was passed by the House.

"House Budget Committee Chairman Paul Ryan's budget plan would get at least 62 percent of its $5.3 trillion in nondefense budget cuts over ten years (relative to a continuation of current policies) from programs that serve people of limited means said the CBPP. "This stands a core principle of President Obama's fiscal commission on its head and violates basic principles of fairness."

clip_image001

Whereas the core principal of Republican ideology is that the wealthiest create jobs and so most wealth should flow to them, hence the "trickle-down' name. But in fact too much debt, both private and public, caused our greatest recession. What built up so much debt? The so-called trickle-down economics of Presidents Reagan and Bush II that ran up the largest budget deficits since World War II with meager economic growth to show for it.

President Clinton even said it at the Democratic convention. Democrats who believe that government has to work for the people have 'outgrown' Republican administrations over the past 52 years. “We Democrats think the country works better with a strong middle class, real opportunities for poor people to work their way into it and a relentless focus on the future, with business and government working together to promote growth and broadly shared prosperity. We think 'we're all in this together' is a better philosophy than 'you're on your own.'

Who's right? Well since 1961, the Republicans have held the White House 28 years, the Democrats 24. In those 52 years, our economy produced 66 million private sector jobs. What's the jobs score? Republicans 24 million, Democrats 42 million!"

Neither trickle-down economics, nor the wealth redistribution upward that accompanies it have been good for the country, such as Romney's 47 percent solution.

Harlan Green © 2012