Thursday, June 27, 2013

Pending Home Sales Soaring As Well

The Mortgage Corner

Watch out, homebuyers! There may be few homes left on the market if the National Association of Realtors’ May Pending Home Sales Index is any predictor of future sales. This is even though mortgage rates have risen almost 1 percent in 3 weeks, as I said last week.

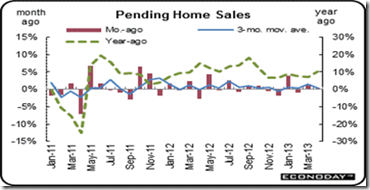
The pending home sales index surged 6.7 percent in May to its highest level since 2006. This has to be because of those rising mortgage rates as prospective buyers want to act before rates could move even higher. The index posted double-digit percentage increases in the Midwest and West. The index level of 112.3 is the highest since the boom days of 2006. The year-on-year gain for the index is 12.1 percent, which is interestingly right in line with double-digit gains for many home-price readings.

clip_image002

Graph: Wrightson ICAP

To the extent that the surge reflected fence sitters jumping into action, there might be some payback in future months, says Wrightson ICAP. “Also, the big increase could partly reflect seasonal adjustment difficulties, as this is the third consecutive year of May gains in the 5-to-7 percent range. Nevertheless, this is a strong report, and it suggests that existing home sales could rise to around 5.5 million in June, which would be the strongest showing since 2007.”

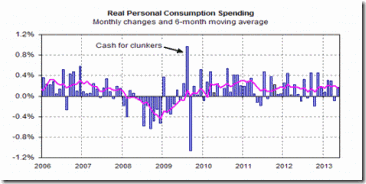
Another reason for the burst in pending home sales is the consumer sector made a comeback in May with income and spending improving. Personal income gained 0.5 percent after a 0.1 percent rise in April. Expectations were for a 0.2 percent increase. The wages & salaries component advanced 0.3 percent, following a 0.1 percent increase.

The latest inflation numbers contained in the PCE report confirm Fed officials concern that inflation is running too low. Year-on-year, PCE headline prices were up only 1.0 percent in May versus 0.7 percent in April, with the core was up just 1.1 percent. These numbers are well below the Fed's inflation target of 2.0 to 2.5 percent. And the savings rate increased to 3.5 percent, which means consumers are still holding on to much of their income, out of caution, no doubt.

clip_image004

Graph: Wrightson ICAP

It has to be why consumer confidence is in effect soaring. The Conference Board’s Director of Research Lynn Franco said why: “…Consumers are considerably more positive about current business and labor market conditions than they were at the beginning of the year. Expectations have also improved considerably over the past several months, suggesting that the pace of growth is unlikely to slow in the short-term, and may even moderately pick up.”

Expectations are also at a recovery best, up nearly 9 points to 89.5 and reflecting rising confidence in the long-term outlook for the jobs market. The outlook for income is likewise climbing with more now seeing an increase ahead vs. those seeing a decrease. This is an important indication that hints at gains for consumer spending including discretionary spending.

There could be a housing hiccup if mortgage rates continue to climb. But we don’t believe they will. There is no inflation, and interest rates did soften a bit this week after several Fed Governors, such as new Fed Governor Jerome Powell indicated the markets had overreacted.

“The reaction of the forward and futures markets for short-term rates appears out of keeping with my assessment of the [Federal Open Market] Committee’s intentions, given its forecasts,” Mr. Powell said. “To the extent the market is pricing in an increase in the federal funds rate in 2014, that implies a stronger economic performance than is forecast either by most FOMC participants or by private forecasters.”

The economy isn’t growing fast enough to cause the Fed to begin downsizing it QE3 program, in other words, particularly with the huge downward revision just reported of first quarter GDP growth to 1.8 percent from 2.4 percent.

Harlan Green © 2013

Follow Harlan Green on Twitter: www.twitter.com/HarlanGreen

Tuesday, June 25, 2013

New-Home Sales Up, Delinquencies Down

The Mortgage Corner

Lots of news today. New-home sales are surging, while mortgage delinquencies and foreclosures continue to drop. Consumer sentiment is also up sharply, maybe because housing prices are soaring according to both the S&P Case-Shiller and FHFA (for conforming loans) housing price indices.

This is even though mortgage rates have risen almost 1 percent in 3 weeks—or maybe housing is booming because buyers are rushing to buy before rates go up any higher!  In fact, homes are being purchased faster than they can be built.

Anyway, the Census Bureau just reported new-home sales in May were at a seasonally adjusted annual rate (SAAR) of 476 thousand. This was up from 466 thousand SAAR in April (April sales were revised up from 454 thousand). February sales were also revised up from 429 thousand to 445 thousand, and March sales were revised up from 444 thousand to 451 thousand, which are very strong upward revisions, needless to say.

clip_image002

Graph: Calculated Risk

This is while inventories shrank to a 4.1 month supply—why prices are rising so fast, and the reason for the surge in housing construction as builders strain to fill the demand for new homes. The U.S. Census Bureau had already reported privately-owned housing starts in May were at a seasonally adjusted annual rate of 914,000. This is 28.6 percent above the May 2012 rate of 711,000, as we said last week.

Also thanks to Calculated Risk, the First Look report for May released today by Lender Processing Services (LPS) reported the percent of loans delinquent for loans 30 or more days past due, but not in foreclosure, decreased to 6.08 percent from 6.21 percent in April. Note: the historical rate for delinquencies of all loans has been in the 4 percent range.

It has to be why consumer confidence is in effect soaring. Consumer confidence is at a recovery best, reports Conference Board, at 81.4 in June and up nearly 7 points from a revised 74.3 in May for the third straight strong gain. The assessment of the present situation is also up at a recovery best 69.2 which hints at general strength for the June economic indicators.

Director of Research Lynn Franco said, “Consumer Confidence increased for the third consecutive month and is now at its highest level since January 2008 (Index 87.3). Consumers are considerably more positive about current business and labor market conditions than they were at the beginning of the year. Expectations have also improved considerably over the past several months, suggesting that the pace of growth is unlikely to slow in the short-term, and may even moderately pick up.”

clip_image004

Graph: Econoday

Expectations are also at a recovery best, up nearly 9 points to 89.5 and reflecting rising confidence in the long-term outlook for the jobs market. The outlook for income is likewise climbing with more now seeing an increase ahead vs. those seeing a decrease. This is an important indication that hints at gains for consumer spending including discretionary spending.

And the S&P Case-Shiller 10 and 20-city Home Price Indexes, boosted by lack of supply and perhaps a sense of urgency if not panic among buyers, are shooting straight up. Case-Shiller's adjusted month-to-month gain for its 20-city index is up 1.7 percent in April alone and follows a 1.9 percent jump in March. The year-on-year rate is exceptionally strong, at plus 12.0 percent.

clip_image006

Graph: Econoday

Gains are sweeping across all cities without exception with strength centered out West where monthly gains are nearing 3 percent with year-on-year gains reaching 20 percent.

But what happens if mortgage rates continue to rise? The 30-year conforming fixed rate is now up to 4.0 percent with a 1 point origination fee in California, 4.25 percent with no origination fee. The so-called High Balance Conforming rate is one quarter percent higher. That might slow the price increases, as borrowers find it harder to qualify for larger loan amounts. And the Fed is now saying they will slow bond purchases by the end of this year; one more reason that buyers are flocking to the housing market.

Harlan Green © 2013

Follow Harlan Green on Twitter: www.twitter.com/HarlanGreen

Monday, June 24, 2013

Managing Fed’s Expectations—Why Austerity Now?

Popular Economics Weekly

It seems that Ben Bernanke’s Federal Reserve has lost its nerve. Last week’s FOMC meeting confirmed that its Open Market Committee has decided to end the monthly QE3 security purchases sooner rather than later. We already see the damage it has done to both stocks and bonds—worldwide. It also solves the puzzle about why President Obama basically fired him in a Charlie Rose interview when Obama said, “He’s already stayed a lot longer than he wanted or he was supposed to.” Obama must have known the Fed Governors’ decision in advance.

If not a loss of nerve, why would the Fed in effect reverse course? It had been trying to manage expectations that its easy money policies would lead to higher future growth and slightly higher inflation by saying that the U.S. unemployment rate had to drop to 6.5 percent before it would begin to raise interest rates.

Was the economy heating up? No. Was inflation out of control? No, it was still falling. Even 6.5 percent was an unemployment rate that would never have been tolerated in the past for long. But it is being tolerated now, and so is the agony of prolonged unemployment.

image

Graph: Trading Economics

Instead the Bernanke’s abrupt announcement showed how easy it is to change the course of expectations by one press conference—on a dime, even. The markets’ reaction is telling the Fed that expectations have been reversed, that growth is not yet strong enough to warrant taking the foot off the gas pedal, to use Bernanke’s own metaphor.

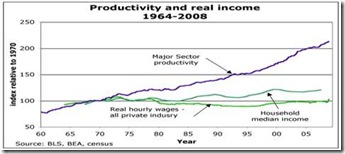
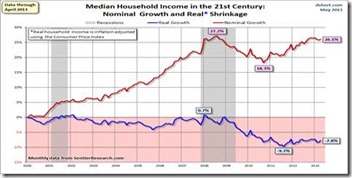
Time will tell, of course, but with median household incomes still depressed—down some 7.8 percent since 2000 after inflation—there was the hope that Bernanke would stick to his word. Now he is saying even if the unemployment rate fell to 7 percent, they could begin to taper their security purchases later this year.

clip_image004

Graph: dshort.com

That is what we heard. It can only mean that even the Federal Reserve is now locked in the grasp of what Paul Krugman and others have called the “monopolists”; those who espouse higher interest rates over higher employment. They are the money managers and owners who would rather pad their own pockets than that of their employees.

“So what’s really different about America in the 21st century,” asks Krugman? “The most significant answer, I’d suggest, is the growing importance of monopoly rents: profits that don’t represent returns on investment, but instead reflect the value of market dominance.”

The massive selloff of debt and equities means the markets must envision a massive slowdown in growth, as investors withdraw from the markets. And so the safest solution is hoard their cash, as was done during the Great Recession. Cash, after all, is the best recession hedge of all. It is the ultimate flight to quality when the odds increase for another downturn, which the Fed may inadvertently now be encouraging rather than preventing.

Harlan Green © 2013

Follow Harlan Green on Twitter: www.twitter.com/HarlanGreen
Saturday, June 22, 2013

Whither Mortgage Rates?

The Mortgage Corner

Ok, the fats in the fire now with the Fed saying it will begin to taper its QE3 purchases that have been holding down mortgage rates by the end of 2013. Rates have been surging since then. The 30-year conforming fixed rate guaranteed by Fannie Mae and Freddie Mac is up almost 1 percent in 1 month.

clip_image002

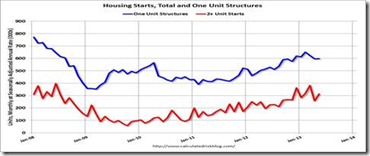
So how much will this crimp the housing recovery, just now gathering steam? The all important single-family housing starts in May (that helps to determine whether the homeownership rate will increase) was at a rate of 599,000, according to the National Association of Home Builders and has been rising since January 2011, up some 33 percent from its most recent low.

This is why builder confidence in new-home construction has increased, as we said. But with 30-year conforming fixed rates now 4.25 percent, up from 3.50 percent as recently as the week before Bernanke’s first pronouncement that QE3 would be on the wane by year end, the rising costs will hit those in the lower income brackets.

For instance at the $208,000 national median home price the monthly payment would increase just $49/mo with a 20 percent down payment, a 6 percent increase. But the result is magnified in the debt to income ratio requirement for qualification, which is 43 percent. The qualification income would have to be approximately 5 percent higher, or housing price 5 percent lower, equal to $197,600, a $10,400 reduction in buying power, assuming other debts are equal.

So this would affect entry-level, first time homebuyers for the most part. But that is about 40 percent of home purchases during normal times. So in effect the Federal Reserve is cutting loose first-time homebuyers from the possibility of purchasing anything but so-called “affordable” housing with mandated price controls. And we know how few affordable units are built even during normal times.

Of course should Fannie Mae and Freddie Mac return to the private sector from government conservatorship, entry-level home buying could continue, since their interest rates have historically been lower than that of commercial banks. Critics have said this is because of the “implicit” government guaranteed to bail them out, and their thin market capitalization.

But their profits have been boosted by record-low interest rates, a booming housing market, and Fannie and Freddie’s very low default rates; the result of strict underwriting guidelines that require excellent credit, adequate income and assets.

There is in fact no reason banks can’t return to the mortgage market on their own, rather than rely on Fannie and Freddie, who now guarantee some 90 percent of mortgages originated. Renown banking analyst Richard Bove predicts banks are at the beginning of a record run in profits that could last 14 years.

“"What I'm suggesting is for the next 14 years — you'll have some setbacks, some recessions — (but) bank earnings will do what they did from 1992 to 2006," he said. "They're going to go straight up."

Even better news is that inventories of existing homes continue to increase from record lows as banks continue to decrease their holdings of distressed homes. So far in 2013, inventory is up 14.9 percent, according to Housing Tracker. But inventory is still very low, down 15.8 percent from the same week last year according to Housing Tracker. 

clip_image004

Graph: Calculated Risk

Calculated Risk’s Bill McBride opines that inventory is well above the peak percentage increases for 2011 and 2012, which suggests that inventory is near the bottom. I believe it can only go up from now, as I said last week. The reason is housing values continue to increase, up as much as 25 percent from their lows in Florida, California, and Nevada, states hardest hit by the housing bust.

The bottom line is activity in the housing sector is heating up with existing-home sales rising 4.2 percent to a seasonally adjusted annual rate of 5.18 million in May from 4.97 million in April, and is 12.9 percent above the 4.59 million-unit pace in May 2012.

clip_image006

Graph: Calculated Risk

Total housing inventory at the end of May rose 3.3 percent to 2.22 million existing homes available for sale, which represents a 5.1-month supply at the current sales pace, down from 5.2 months in April. Listed inventory is 10.1 percent below a year ago, when there was a 6.5-month supply.

The only fly in this ointment is whether mortgage rates will continue to rise. This might also slow price increases as borrowers find it harder to qualify for larger loan amounts.

But rates can’t go much higher for the moment, unless and until we approach fuller employment and economic growth really takes off. It would trigger the end of QE3 altogether and perhaps the Fed beginning to raise shorter term rates. But that is the best of all worlds and means a return to more normal times, at last. For rising rates means a greater demand for money, due to a faster growing economy, something we all want.

Harlan Green © 2013

Follow Harlan Green on Twitter: www.twitter.com/HarlanGreen

Thursday, June 20, 2013

Did Bernanke Change His Tune?

Financial FAQs

As we all know by now, Fed Chairman Bernanke seems to have abruptly switched sides in the stimulus debate. He said the purchases of $85 billion in bonds and mortgage securities could begin to be ‘tapered’ by the end of the year, if unemployment continues to fall—maybe to 7 percent.

Of course stock and bond prices plunged as they did 3 weeks ago, when he first mentioned the possibility, because there are few indications that employment will improve that much, and inflation reverse its downward plunge. Many, such as Nobelist Paul Krugman, believe he is wrong in making that pronouncement at the latest FOMC meeting and press conference afterward.

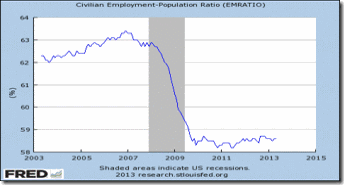
“My (initial) reaction is, this is not good. They might get away with it, but there’s also a serious chance that this will end up looking like a historic mistake. Bear in mind, first, that the US economy is still deep in the hole, which is especially obvious if you look at employment rather than unemployment:”

clip_image002

Graph: St Louis Fed

“Aging of the population accounts for some but not much of the fall in the employment ratio; the fact is that we are still a very long way from acceptable employment levels,” said Krugman. “Meanwhile, inflation remains below the Fed’s target. Maybe the Fed believes that the situation will improve — but as everyone points out, the Fed has been consistently over-optimistic since the crisis began. And for now the economy still needs all the help it can get.”

So why is Bernanke suddenly so optimistic about growth? Bond guru Bill Gross, for one, thinks the markets are misreading Bernanke, because Bernanke said at the same press conference that inflation now at 1.1 or 1.4 percent (depending on which indicator is used) has to approach its 2-2.5 percent target range, and unemployment has to come down to 6.5 percent from its 7.6 percent rate before the Fed will stop its QE3 purchase of securities.

So this tells us the importance of low interest rates during this recovery, when household incomes are still stagnant, mainly due to almost no growth in wages and salaries—the income earned by most households (therefore consumers), as I said in my last column.

clip_image004

Graph: Trading Economics

Meanwhile, inflation is still declining, not a good sign, so Bernanke must be attempting to manage expectations that economic growth is more robust that we know at present. I.e., he wants us to believe that in fact the economy is recovering faster than at present. I hope he is right in seeing better growth in the tea leaves—that the rest of us don’t yet see.

He might be right. Real estate at least is showing a better recovery. Existing-home sales rose 4.2 percent in May to a seasonally adjusted annual rate of 5.18 million -- the highest rate since November 2009, when a buyer tax credit deadline approached -- pointing to a continuing recovery, the National Association of Realtors reported Thursday. Sales of existing homes in May were 12.9 percent higher than during the same period in the prior year.

Harlan Green © 2013

Follow Harlan Green on Twitter: www.twitter.com/HarlanGreen

Wednesday, June 19, 2013

Economic Growth Stronger Than Predictions?

Popular Economics Weekly

There are signs that economists have underestimated GDP growth this year. The New York Times surveyed economists in a recent Sunday front page article, that said growth could increase to 3 percent from the 2 percent norm of the past 3 years. “That is the surprising new view of a number of economists in academia and on Wall Street, who are now predicting something the United States has not experienced in years: healthier, more lasting growth,” said the Nicholas D. Schwartz article.

And consumers are spending more. May retail sales surprised on the upside and increased 0.6 percent on the month and were up 4.3 percent from a year ago. Retail sales excluding just autos and excluding both autos and gasoline were up 0.3 percent from April, much as expected. On the year, they were up 2.8 percent and 4.1 percent respectively.

clip_image002

Graph: Econoday

This is reflected in consumer confidence numbers. Consumer sentiment has been oscillating upward slowly since the mid-2011 plunge. Consumer spirits have been on a climb the last couple of months, but dipped back mid-June to 82.7 versus May's 84.5.

The consumer's fundamental outlook for the economy is little changed with the expectations component rising nearly 1 point to 76.7 which is near a recovery high. In fact, the current conditions outlook is almost back to 2006 levels.

The nonpartisan Congressional Budget Office also sees relatively fast growth of 3.4 percent next year, and 3.6 percent between 2015 and 2018. A few other private economists are even more bullish, according to the New York Times article. Jim Glassman, senior economist at JP Morgan Chase’s commercial bank, estimates the economy could expand by 4 percent in both 2014 and 2015. If that were to come to pass, it would be the strongest back-to-back annual growth since the late 1990s.

There are many ingredients that could boost economic growth. The U.S. could become a net exporter of oil and gas in the coming decades. Health care costs are declining thanks to Obamacare, or the Affordable Care Act, according to many analysts. And housing may now be leading the recovery, while household net worth has increased some $3 trillion in Q1 2013, according to the Federal Reserve’s Flow of Funds report.

In fact, household debt continues to decline, also making consumers more optimistic about their future. The Calculated Risk graph shows the Debt to Service Ratio for both renters and homeowners (red), and the homeowner financial obligations ratio for mortgages (blue) and consumer debt (yellow).

clip_image004

Graph: Calculated Risk

Almost all of the ratios are down to levels that prevailed in the1990s (graph begins in 1980). This is both because of historically low interest rates, rates that we haven’t seen since World War II, and the large number of foreclosures and short sales that have reduced mortgage debt by as much as one-third in some regions.

That tells us the importance of low interest rates during this recovery, when household incomes are still stagnant, mainly due to almost no growth in wages and salaries—the income earned by most households (therefore consumers).

In fact, real, after inflation household incomes have declined 7.8 percent since the end of the Great Recession, which is the ‘real’ reason this recovery has been so painfully slow.

clip_image006

Graph: dshort.com

As Doug Short says in his excellent blog column, “The stunning reality illustrated here is that the real median household income series spent most of the first nine years of the 21st century struggling slightly below its purchasing power at the turn of the century.”

Harlan Green © 2013

Follow Harlan Green on Twitter: www.twitter.com/HarlanGreen

Tuesday, June 18, 2013

Housing Construction Key to Economic Recovery

The Mortgage Corner

Any doubts that housing is leading the economic recovery should be dispelled by now. Existing-home sales are projected to top 5 million units per year, as the so-called shadow inventory of distressed homes continues to fall due to pent up demand and sharply rising housing prices.

Even more telling is the surge in housing construction as builders strain to fill the demand for new homes. The U.S. Census Bureau just reported privately-owned housing starts in May were at a seasonally adjusted annual rate of 914,000. This is 6.8 percent above the revised April estimate of 856,000 and is 28.6 percent above the May 2012 rate of 711,000.

clip_image002

Graph: Calculated Risk

The all important single-family housing starts in May that determines whether the homeownership rate will increase were at a rate of 599,000; this is 0.3 percent above the revised April figure of 597,000. The May rate for units in buildings with five units or more was 306,000.

This is why builder confidence in the resurgence in housing construction has increased, boosting housing stocks. Builder confidence in the market for newly-built single-family homes hit a significant milestone in June, surging eight points to a reading of 52 in the just released National Association of Home Builders/Wells Fargo Housing Market Index (HMI). It is a poll of home builders, so that any number over 50 percent indicates that more builders view sales conditions as good than poor.

“This is the first time the HMI has been above 50 since April 2006, and surpassing this important benchmark reflects the fact that builders are seeing better market conditions as demand for new homes increases,” said NAHB Chairman Rick Judson. “With the low inventory of existing homes, an increasing number of buyers are gravitating toward new homes.”

Even better news is that inventories of existing homes continue to increase from record lows as banks continue to decrease their holdings of distressed homes. So far in 2013, inventory is up 14.9 percent, according to Housing Tracker. But inventory is still very low, and is down 15.8 percent from the same week last year according to Housing Tracker. 

clip_image004

Graph: Calculated Risk

Calculated Risk’s Bill McBride opines that inventory is well above the peak percentage increases for 2011 and 2012, which suggests that inventory is near the bottom. I believe it will continue to increase. The reason is housing values continue to increase, up as much as 25 percent from their lows in Florida, California, and Nevada, states hardest hit by the housing bust.

We reported last week that Pending Home Sales Index, a forward-looking indicator based on contract signings, rose 0.3 percent to 106.0 in April from 105.7 in March, and is 10.3 percent above April 2012 according to the National Association of Realtors. The data reflect contracts but not closings.

And the S&P Case-Shiller Home Price Index reported the year-on-year increase of 10.9 percent is the first double-digit gain since May 2006.

The bottom line is activity in the housing sector is heating up with April existing-home sales rising 0.6 percent to an annual rate of 4.97 million. Supply, which had been very tight, poured into the market during April with 230,000 units added to lift the months supply to 5.2 from 4.7 months. The median time for a house on the market fell dramatically, to 46 days vs 62 days in March.

The only fly in this ointment is whether mortgage rates will continue to rise. The 30-year conforming fixed rate is up to 3.75 percent with a 1 point origination fee in California, 4 percent with no origination fee. That might slow the price increases, as borrowers find it harder to qualify for larger loan amounts. But they can’t go much higher if the Fed maintains it QE3 bond purchases for at least the rest of this year, which it has said it will do. We will see.

Harlan Green © 2013

Follow Harlan Green on Twitter: www.twitter.com/HarlanGreen

Monday, June 17, 2013

Housing Recovery Is For Real

The Mortgage Corner

Those who doubt the real estate recovery aren’t paying attention to the latest sales’ data. We reported last week the Pending Home Sales Index, a forward-looking indicator based on contract signings, rose 0.3 percent to 106.0 in April from 105.7 in March, and is 10.3 percent above April 2012 according to the National Association of Realtors. The data reflect contracts but not closings.

And Southern California home sales were the highest since May 2006, reports DataQuick, The median price paid for all new and resale houses and condos sold in the six-county Southland was $357,000 last month, up 23.1 percent from $290,000 in April 2012, and the highest since June 2008, when the median was $360,000. “What seems obvious is that if prices keep rising fast they’ll cause many more people to list their homes for sale,” said DataQuick President John Walsh, “and that increase in supply should at least slow the rate of price appreciation,” he said.

The doubters are mainly those who believe the Federal Reserve is artificially stimulating home sales by keeping interest rates so low, such as Barron’s conservative economist Gene Epstein. “Why barely one cheer, then (for the housing recovery)? Because this housing recovery has been so stuffed with government steroids, you wonder if it could make it on its own if these drugs were withdrawn.”

But lower interest rates are necessary when consumers buying power has shrunk so badly due to the Great Recession. That is to say, such low interest rates make housing more affordable for the majority of home buyers. Rates will rise of their own accord when incomes (and so inflation) begins to rise, and business activity heats up. Interest rates are really controlled by the demand for money, which increases when spending increases.

Home contract activity is at the highest level since the index hit 110.9 in April 2010, immediately before the deadline for the home buyer tax credit.  Pending sales have been above year-ago levels for the past 24 months.

clip_image002

Graph: Econoday

Lawrence Yun, NAR chief economist, said a familiar pattern has developed.  “The housing market continues to squeak out gains from already very positive conditions.  Pending contracts so far this year easily correspond to higher closed home sales in 2013,” he said.  Total existing-home sales are expected to rise just over 7 percent to about 5 million this year.”

This is huge, and though inventories are rising, it’s not enough to keep prices from continuing to rise. “Because of inventory shortages, higher home sales will push up home values to the highest level in five years,” Yun said.  The national median existing-home price should increase close to 8 percent and exceed $190,000 in 2013.

And the S&P Case-Shiller Home Price Index reports the year-on-year increase of 10.9 percent is the first double-digit gain since May 2006.

clip_image004

Graph: Econoday

The bottom line is activity in the housing sector is heating up with April existing-home sales rising 0.6 percent to an annual rate of 4.97 million. Supply, which had been very tight, poured into the market during April with 230,000 units added to lift the months supply to 5.2 from 4.7 months. The median time for a house on the market fell dramatically, to 46 days vs 62 days in March.

And sellers are getting their price based on the report's price data. After jumping 6.2 percent in March, the median price rose another 4.8 percent in April to $192,800 which is the highest level of the recovery. We should note that price data in this report, which are not based on repeat transactions, are often volatile. But who can argue with a double digit year-on-year median gain at 11.0 percent?

Harlan Green © 2013

Follow Harlan Green on Twitter: www.twitter.com/HarlanGreen
Sunday, June 16, 2013

Fannie Mae/Freddie Mac Dilemma Won’t End Soon

Popular Economics Weekly

The U.S. Treasury is in a bind. Everyone seems to agree that Fannie and Freddie, wards of the government should be downsized, but how to do it without damaging the housing recovery? Extreme conservatives even want to abolish them, along with the Federal Reserve, Departments of Commerce, Education, etc., etc. That isn’t practical, of course—especially abolishing Fannie and Freddie because they currently supply more than 90 percent of all mortgages!

That is one reason even a hint by Fed Chairman Bernanke and others that the Fed might “taper” QE purchases has caused interest rates to rise sharply. Because former Goldman Sachs chief economist Jim O’Neill and others have trumpeted that bond interest rates could reach 4 percent, if and when the Fed slows its QE purchases, returning to “more normal valuations” when the economy does recover.

This in turn means that mortgage rates would return to their recent 6 percent range for conforming 30-year fixed rates, from today’s 4 percent. But that would be devastating to a recovering housing market. Household incomes are still stagnant—in fact have been for the past 30 year, when accounting for inflation.

Keeping interest rates so low has made housing more affordable at these lower income levels. That is the major reason for the Fed’s QE3 buying program.

The Fed has also said unemployment has to fall further, as we have said, and there are few signs that GDP growth will be more than 2 percent this year.

Bond investors also watch inflation, and right now inflation is falling. The Personal Consumption Expenditure Index favored by the Fed is currently 1 percent, which is 1 percent below the Fed’s target of 2 percent. So why would the Fed even begin to “taper” their $85 billion per month in security purchases when neither is happening; and real estate is at the beginning of its recovery?

And sure enough, the Fed has just hinted in a recent Wall Street Journal Op-ed by John Hilsenrath that they aren’t in a hurry to taper their QE3 purchases—just yet. “The Fed, he (Bernanke) said in his March press conference and again at testimony to Congress last month, expects a “considerable” amount of time to pass between ending the bond-buying program and raising short-term rates. He seems likely to press that point at his press conference next week, given that the markets are telling him they don’t believe it.”

“In recent years, the search for yield has gone wider and deeper,” said O’Neill in the same Op-ed. “The resulting deviation from normal valuations has been amplified by the shift of pension funds and insurance companies out of equities into fashionable bonds, and by the lingering effects of the great financial crisis of 2008 and 2009. It seems inevitable that some version of the shock of 1994 is going to happen again.”

What “shock of 1994”? That was when Orange County went bankrupt because then Fed Chairman Greenspan boosted interest rates abruptly in the spring of 1994, after holding them at record lows in 1992-93, to cure the 1991 recession. But Greenspan did it without any warning, which is why Orange County lost so much money betting that interest rates would continue to fall.

So, really the panicked selling of stocks and bonds, and recent rise in interest rates are a sign that economic growth is still fragile, so that even a hint of credit tightening will depress markets. It is the Federal Reserve that is goosing growth, after all, especially in the real estate sector.

As if to corroborate the Fed’s efforts, Southern California home sales were the highest since May 2006, reports DataQuick, The median price paid for all new and resale houses and condos sold in the six-county Southland was $357,000 last month, up 23.1 percent from $290,000 in April 2012, and the highest since June 2008, when the median was $360,000. “What seems obvious is that if prices keep rising fast they’ll cause many more people to list their homes for sale,” said DataQuick President John Walsh.

But that can’t happen if interest rates continue to rise as quickly—and certainly not if they return to more “normal valuations”. So government shouldn’t be in a hurry to downsize Fannie and Freddie, either, since it doesn’t look like Wall Street or the banks are willing to support the housing market without Fannie and Freddie’s help.

Harlan Green © 2013

Follow Harlan Green on Twitter: www.twitter.com/HarlanGreen

Monday, June 10, 2013

Pending Home Sales, Prices Continue to Rise

The Mortgage Corner

Those who doubt the real estate recovery aren’t paying attention to the latest sales’ data. We reported last week the Pending Home Sales Index, a forward-looking indicator based on contract signings, rose 0.3 percent to 106.0 in April from 105.7 in March, and is 10.3 percent above April 2012 according to the National Association of Realtors. The data reflect contracts but not closings.

The doubters are mainly those who believe the Federal Reserve is artificially stimulating home sales by keeping interest rates so low, such as Barron’s conservative economist Gene Epstein. “Why barely one cheer, then (for the housing recovery)? Because this housing recovery has been so stuffed with government steroids, you wonder if it could make it on its own if these drugs were withdrawn.”

But lower interest rates are necessary when consumers buying power has shrunk so badly due to the Great Recession. That is to say, such low interest rates make housing more affordable for the majority of home buyers. Rates will rise of their own accord when incomes (and so inflation) begins to rise, and business activity heats up. Interest rates are really controlled by the demand for money, which increases when spending increases.

Home contract activity is at the highest level since the index hit 110.9 in April 2010, immediately before the deadline for the home buyer tax credit.  Pending sales have been above year-ago levels for the past 24 months.

clip_image002

Graph: Econoday

Lawrence Yun, NAR chief economist, said a familiar pattern has developed.  “The housing market continues to squeak out gains from already very positive conditions.  Pending contracts so far this year easily correspond to higher closed home sales in 2013,” he said.  Total existing-home sales are expected to rise just over 7 percent to about 5 million this year.

This is huge, and though inventories are rising, it’s not enough to keep prices from continuing to rise. “Because of inventory shortages, higher home sales will push up home values to the highest level in five years,” Yun said.  The national median existing-home price should increase close to 8 percent and exceed $190,000 in 2013.

And the S&P Case-Shiller Home Price Index reports the year-on-year increase of 10.9 percent is the first double-digit gain since May 2006.

clip_image004

Graph: Econoday

The bottom line is activity in the housing sector is heating up with April existing-home sales rising 0.6 percent to an annual rate of 4.97 million. Supply, which had been very tight, poured into the market during April with 230,000 units added to lift the months supply to 5.2 from 4.7 months. The median time for a house on the market fell dramatically, to 46 days vs 62 days in March.

And sellers are getting their price based on the report's price data. After jumping 6.2 percent in March, the median price rose another 4.8 percent in April to $192,800 which is the highest level of the recovery. We should note that price data in this report, which are not based on repeat transactions, are often volatile. But who can argue with a double digit year-on-year median gain at 11.0 percent?

Harlan Green © 2013

Follow Harlan Green on Twitter: www.twitter.com/HarlanGreen

Friday, June 7, 2013

What Will the Federal Reserve Do??

Popular Economics Weekly

Now the fat’s in the fire. Both stocks and bond prices have been falling of late, due to the fear that the Fed will end its $85 billion per month QE purchases of Treasury and mortgage securities too soon. Fed Chairman Bernanke had said that if employment continued to improve, the Fed might begin to “taper” its purchases as soon as its June FOMC meeting.

And today the Bureau of Labor Statistics reported the May unemployment report rose from 7.5 to 7.6 percent because 420,000 more people are looking for work, though 175,000 more payroll jobs were created in May! So what’s the Fed to do? On the face of it, the Fed can’t begin to end QE purchases because its stated goal of 6.5 percent unemployment isn’t close to being reached.

image

Graph: Calculated Risk

And both inflation indexes and consumer incomes show there is still insufficient demand for more goods and services that would cause the U.S. economy to grow closer to its normal longer term GDP growth rate of 3.5 percent. It grew just 2.2 percent last year, and predictions for 2013 are not much better.

This graph of personal consumption expenditure prices illustrates the problem. Prices have been falling, and when prices fall, so do profits. Hence wages and so employment remains stagnant, stuck where it has essentially been over the past 3 years. Then why are we worried?

image

Inflation hasn’t been running at the 2 to 2.5 percent average that prevailed before the Great Recession, in other words. Hence those calling for an early exit from QE are doing the country a disservice. It means fewer new jobs and therefore more remaining unemployed. The Bureau of Labor Statistics said some 13.6 million are “marginally attached” to the labor force and still looking for full time work. The unemployment rate for them is an even larger 13.8 percent — down from 13.9 percent in April — if everyone who wants a full-time job but can’t find one is included. Millions of Americans still cannot find work nearly four years after the recession ended.

So who is calling for an early end to QE? No less than Former Fed Chairman Alan Greenspan, for one. "Bond prices have got to fall. Long-term rates have got to rise. The problem, which is going to confront us, is we haven't a clue as to how rapidly that's going to happen. And we must be prepared for a much more rapid rise than is now contemplated in the general economic outlook."

But interest rates generally rise and fall in tandem with inflation, and inflation is still falling. That means getting closer to full employment, which is when inflation historically becomes a problem. So we have a long way to go before worrying about interest rates rising too fast.

Harlan Green © 2013

Follow Harlan Green on Twitter: www.twitter.com/HarlanGreen

Tuesday, June 4, 2013

Housing Prices Rise as Foreclosure Rates Fall

The Mortgage Corner

Home prices are continuing to rise, in part because foreclosure rates continue to fall. Fannie Mae reported that the Single-Family Serious Delinquency rate declined in April to 2.93 percent from 3.02 percent in March. The serious delinquency rate, covering loans 90 days or more delinquent or in foreclosure, is the lowest level since January 2009.The Fannie Mae serious delinquency rate peaked in February 2010 at 5.59 percent.

Foreclosed homes tend to sell for 33 percent less than normal market prices, which depresses housing values. So the drop in foreclosures means fewer homes are sold at under market prices.

Freddie Mac reported that the Single-Family serious delinquency rate declined in April to 2.91 percent from 3.03 percent in March. Freddie's rate is down from 3.51 percent in April 2012, and this is the lowest level since June 2009. Freddie's serious delinquency rate peaked in February 2010 at 4.20 percent.

This is while CoreLogic reported home prices nationwide, including distressed sales, increased 12.1 percent on a year-over-year basis in April 2013 compared to April 2012. This change represents the biggest year-over-year increase since February 2006 and the 14th consecutive monthly increase in home prices nationally. On a month-over-month basis, including distressed sales, home prices increased by 3.2 percent in April 2013 compared to March 2013.

image

Graph: Calculated Risk

Excluding distressed sales, home prices increased on a year-over-year basis by 11.9 percent in April 2013 compared to April 2012, but longer-term housing prices will rise faster when excluding distressed sales, says CoreLogic. This is because CoreLogic’s distressed sales include short sales and real estate owned (REO) transactions, which could boost overall prices over the short term due to the high demand by investors who are buying up many in bulk.

More evidence that the lack of homes on the market has been driving up prices is pending home sales, or homes under contract but not yet closed, which rose only 0.3 percent in April, following a 1.5 percent boost the month before.

image

Graph: Econoday

The National Association of Realtors Pending Home Sales Index reports home contract activity was at the highest level since the index hit 110.9 in April 2010, immediately before the deadline for the home buyer tax credit.  Pending sales have been above year-ago levels for the past 24 months.

And Econoday reports “a regional look shows the effect of tight inventory which is most severe in the West and where pending home sales fell 7.6 percent. Price data from the West, in reports such as Case-Shiller, have been showing the very sharpest gains. Home-price appreciation is a very big story right now in the economy and this report points to continued upward pressure.”

The bottom line is activity in the housing sector is heating up with April existing-home sales rising 0.6 percent to an annual rate of 4.97 million, according to the National Association of Realtors. Sales of single-family homes, the most important component in the report, rose 1.2 percent in the month

Supply, which had been very tight, poured into the market during April with 230,000 units added to lift the months supply to 5.2 from 4.7 months. The median time for a house on the market fell dramatically, to 46 days vs 62 days in March.

And sellers are getting their price based on the report's price data. After jumping 6.2 percent in March, the median price rose another 4.8 percent in April to $192,800 which is the highest level of the recovery. We should note that price data in this report, which are not based on repeat transactions, are often volatile. But who can argue with a double digit year-on-year median gain of 11.0 percent?

Harlan Green © 2013

Follow Harlan Green on Twitter: www.twitter.com/HarlanGreen
Monday, June 3, 2013

Social Security Isn’t Dead

Popular Economics Weekly

Social Security isn’t dead, or even dying, in spite of the prediction by the Social Security Trustees that it will no longer be able to pay full benefits by 2033. That’s because the Trustees use what are called ‘intermediate’ assumptions of income and tax growth that have prevailed since the huge shift in wealth upward beginning in the 1970s, depressing incomes of the middle and lower income earning brackets.

clip_image002

The Trustees base their projection on growth rates of population, wages and employment that comprise the Gross Domestic Product, and not wanting to be overly optimistic, pick what they believe to be a medium GDP growth rate over the next 75 years in the mid-2 percent range, rather than the longer term historical rate of 3.5 percent over the past 75 years.

There are reasons for optimism, in other words, if employment and wage growth can be brought back to historical levels, instead of assuming more recent growth rates that are result of 5 recessions since 1980, which in turn were the result of experiments with so-called supply-side economics that emphasized lower tax rates for investors and and reduced government spending. This ‘experiment’ resulted in tremendous economic upheavals and $trillions in productive output lost.

clip_image004

Graph: US Social Security Admin

The Social Security Trustees own Alternative I, the “lower cost” estimate, would in fact never run out of funds. Hence the need to focus on what creates economic growth. It’s really a no-brainer.  More growth requires more jobs that pay a living wage for starters, which means more collective bargaining power and the strengthening of labor laws that have been weakened over the past 30 years.

There has been very little research, other than historical, on the ingredients of robust growth. But history does show that the continued transfer of wealth away from the consuming public to the wealthiest, while keeping corporate and high income tax rates as low as possible, hurts overall economic growth.

How? By the outright suppression of collective bargaining of wage and salary earners, either via such corporation backed groups as ALEC, the American Legislative Exchange Council, or Republican majorities in the right to work states that inhibit union organizing efforts, for starters. And those Republican majorities are due in part to blatant voter suppression laws in those states, again supported by the likes of ALEC.

Economists such as Thomas Piketty and Emmanuel Saez have shown that this has been going on for decades—since the 1970s, really, when high income tax brackets began to be lowered under the rationale that it would boost economic growth. But alas, the opposite has happened.

We need another New Deal to bring back the middle and lower class earning potential, real jobs paying wages real wages, in other words. Then we won’t have to worry about social security, worry less about Medicare, and stop the impoverishment of the majority of Americans who actually produce the wealth that should guarantee them a comfortable retirement.

Harlan Green © 2013

Follow Harlan Green on Twitter: www.twitter.com/HarlanGreen