Thursday, December 29, 2016

Case-Shiller Home Prices At New Highs


Financial FAQs

The S&P CoreLogic Case-Shiller U.S. National Home Price NSA Index, covering all nine U.S. census divisions, reported a 5.6 percent annual gain in October, up from 5.4 percent last month. The 10-City Composite posted a 4.3 percent annual increase, up from 4.2 percent the previous month.


Prices have now returned to 2003-4 levels, according to CoreLogic. That is when housing prices began double-digit increases for several years. The 20-City Composite reported a year-over-year gain of 5.1 percent in October, up from 5.0 percent in September. These are same-home price rises averaged over 3 months to make them less volatile.

But the price rises have leveled off at 5.1 percent on average over the past 2 years, a sign that rising housing inventories are beginning to have an effect on prices after prices soared during the housing bubble years. Portland and Seattle housing prices are still rising at 10 percent per year, with Dallas and Denver close behind.

Rising interest rates may also affect next year’s market, though the 30-year fixed conforming rate is still available @3.875 percent for one origination point in California. But Pending Home sales are the lowest in a year, which are contract signings scheduled to close in approximately 60 days, according to the National Association of Realtors chief economist Lawrence Yun.

“The budget of many prospective buyers last month was dealt an abrupt hit by the quick ascension of rates immediately after the election,” Yun said in NAR’s latest report. “Already faced with climbing home prices and minimal listings in the affordable price range, fewer home shoppers in most of the country were successfully able to sign a contract.”

What about housing’s contribution to economic growth? It is still below trend, at close to 4 percent, whereas it has averaged 5 percent historically. So that’s an additional $18 billion that can be added to GDP growth over the next years if housing sales and construction return to more normal times—but only if interest rates continue to rise gradually.


Trump supporters and Republicans believe the housing market will return to more normal times once they reduce the regulatory burden on housing, which they continue to blame on Dodd-Frank and the Consumer Finance Protection Bureau, for some reason. But these entities have been mostly responsible for the massive settlements with banks that sold falsely advertised AAA rated mortgage securities that created those negatively amortized liar loans, the main cause of the housing bubble.

These settlements should deter lenders from making such risky bets in the future, but what if those Dodd-Frank regulations are abolished by a Republican controlled Congress? Who will then stand in the way of future lending abuses that could once more put tax payers at risk?

Incoming Treasury Secretary Steve Mnuchin has been making noises about resuscitating Fannie Mae and Freddie Mac, the main guarantor of conforming mortgages as private entities, albeit with some revisions to pass part of the lending risk onto banks and other lenders. This may be a good thing in that it could ease the strict qualification standards that have hampered some mortgage lending.
But will that confidence in the Trump administration’s efforts to cut red tape translate into a better (and more affordable) housing market? “NAHB expects an increase in single-family home construction next year, fueled by a growing economy and solid job growth,” said NAHB Chief Economist Robert Dietz. “Moreover, builder confidence has risen on anticipation of reductions in regulatory costs, which is good news for home buyers and renters. However, the pace of construction will continue to be restricted by shortages of lots and labor in some markets.”
So though hopes have risen for more housing, all this remains to be seen, in other words.

Harlan Green © 2016

Follow Harlan Green on Twitter: https://twitter.com/HarlanGreen

Tuesday, December 27, 2016

New-Home Sales, Confidence Also At New Highs


The Mortgage Corner

Just as existing-home sales are at their cyclical highs, the Commerce Department on Friday said new home sales increased 5.2 percent to a seasonally adjusted annual rate of 592,000 units last month. That was the second highest pace since 2007, said the NAHB. Economists had forecast single-family home sales, which account for about 9.5 percent of overall home sales, rising 2.1 percent to a 575,000-unit rate last month.


The real problem is still lack of inventory with just 5.1 months of available supply (red line in graph), but builders optimism is the highest since 2005 that they can increase that inventory with a better mix of more affordable housing. Sales rose 16.5 percent from a year ago, boosted by a 43.8 percent jump in the Midwest to a nine-year high. Sales surged 7.7 percent in the West, their highest level since January 2008, but fell 3.1 percent in the South. They were unchanged in the Northeast.

“NAHB expects an increase in single-family home construction next year, fueled by a growing economy and solid job growth,” said NAHB Chief Economist Robert Dietz. “Moreover, builder confidence has risen on anticipation of reductions in regulatory costs, which is good news for home buyers and renters. However, the pace of construction will continue to be restricted by shortages of lots and labor in some markets.”

And consumers are feeling much more confident since the November elections, with most of the jump in older respondents to both the University of Michigan and Conference Board surveys. They are putting a lot of faith that Prez-elect Trump will be able to carry out his election promises of draining the Wall Street/DC swamps, in other words.

Graph Econoday

That said, the U. of Michigan consumer sentiment index edged up to a reading of 98.2 from 98 earlier this month. That was the highest reading since January 2004. And the Conference Board’s confidence index is up 12.9 points since the November election in gains driven by older consumers, as we said. The level for December is 113.7 which is the highest reading since way back in August 2001.

The University of Michigan said a record 18 percent of respondents "spontaneously mentioned the expected favorable impact of Trump's policies on the economy." Consumers anticipated that a stronger economy would create more jobs, with the share expecting higher income rising to a one-year high.

And personal incomes are rising at a 4 percent clip, the unemployment rate has dropped to 4.6 percent, and GDP growth is now up to 3.5 percent in the third revision to Q3 growth, with fourth quarter GDP growth also looking good.

So why shouldn’t consumers feel more confident of the future? It has a lot to do with Republican policies in Congress, yet Repubs say they want to repeal much of Obama’s legacy, which created the recovery from the Great Recession—the worst recession since the Great Depression. And a repeal of Obamacare and Dodd-Frank, the law that is attempting to reign in some of the excesses that caused the Great Recession, could put US back into another recession.

In other words, those voters need to be careful of what they wish for beyond the Twitters of Prez-elect Trump.

Harlan Green © 2016

Follow Harlan Green on Twitter: https://twitter.com/HarlanGreen

Friday, December 23, 2016

Q3 GDP Growth Now 3.5%!

Popular Economics Weekly

The third-quarter lived up to its early expectations, rising with each new revision to an inflation-adjusted 3.5 percent annualized rate for the best showing in two years, said the Commerce Department. The consumer was the main engine in the quarter, spending at a 3.0 percent rate (up from 2.7 percent in the prior estimate) on top of the second quarter's very strong 4.3 percent rate.


In fact, real gross domestic income (GDI), another measure of economic growth, increased 4.8 percent in the third quarter, compared with an increase of 0.7 percent in the second. The average of real GDP and real GDI, a supplemental measure of U.S. economic activity that equally weights GDP and GDI, increased 4.1 percent in the third quarter, compared with an increase of 1.1 percent in the second (table 1).

This is perhaps a more accurate measure of growth since it combines both domestic income and spending, which shows that it may be difficult to implement President-elect Trump’s $1B infrastructure plan. The economy is already fully employed and it will be difficult to goose GDP growth higher, unless exports and hence global demand increases as well.

The increase in real GDP in the third quarter primarily reflected positive contributions from PCE, exports, private inventory investment, nonresidential fixed investment, and federal government spending that were partly offset by negative contributions from residential fixed investment. Imports, which are a subtraction in the calculation of GDP, increased.

More good news is that the GDP price index increased just 1.5 percent, vs. 2.0 percent in Q2, and increased 1.7 percent, excluding energy and food prices. This means very little inflation is occurring, even with the increased economic activity. It’s mainly the still cheap energy prices that hold inflation down, needless to say, due mostly to depressed worldwide demand for commodities, such gas and oil products.

But growth could reach or exceed 4 percent in the fourth-quarter, though it might be held down by a reversal for exports (stronger dollar) and perhaps by less strength in consumer spending, which isn't quite tracking as strongly as the third quarter proved to be, says Econoday.

Lastly, the Federal Reserve Bank of Philadelphia has released the coincident indexes for the 50 states for November 2016. In the past month, the indexes increased in 43 states, decreased in three, and remained stable in four, for a one-month diffusion index of 80, as indicated in the enclosed map.


The green states are those with the highest growth rates, and pink/red states have the least growth. In fact, Alaska, New Mexico, Maine, West Virginia and Alabama economies are still contracting. Growth is flat in Michigan and Louisiana. The four state-level variables in each coincident index are nonfarm payroll employment, average hours worked in manufacturing, the unemployment rate, and wage and salary disbursements deflated by the consumer price index (U.S. city average), which closely mimic Gross Domestic growth.

This is one more sign that most, but not all, of the U.S. has recovered from the Great Recession.

Harlan Green © 2016

Follow Harlan Green on Twitter: https://twitter.com/HarlanGreen

Thursday, December 22, 2016

Top Economics Blog: http://PopularEconomics.com


BusinessEconomics.com 2016 Award Winner: Top Economics Blog PopularEconomics.com

http://www.businesseconomics.com/business-economics-award-winners-2016.html

In determining the awards we received recommendations for 6,856 sites from 57,204 people who voted on our site. When we determined the sites that should be given the awards, we looked at the quality of content, usability, timeliness of content and the extent to which much of the content is accessible to all web users. We are delighted that your website met all of these criteria and was judged to provide an excellent service to internet users.

Many congratulations on being awarded the BusinessEconomics.com award for 2016 as detailed above. This year BusinessEconomics.com has given out three awards in each of the following 37 categories of Business, Economics and Finance sites making 111 awards in total.

1) Top Financial news sites
2) Top Economics news sites
3) Top Business news sites
4) Top Economics blogs
5) Top Finance blogs
6) Top  Business blogs
7) Top MBA sites
8) Top Economics Education sites
9) Top Finance Education sites
10) Top Business Education sites
11) Top Stocks sites
12) Top Bonds sites
13) Top  Foreign Exchange sites
14) Top Commodities sites
15) Top Futures sites
16) Top Options sites
17) Top Emerging Markets sites
18) Top Commercial Banking sites
19) Top investment Banking sites
20) Top Mutual Fund sites
21) Top Insurance sites
22) Top Mergers and Acquisitions sites
23) Top Exchange Traded Fund sites
24) Top Sovereign Wealth Fund sites
25) Top Hedge Fund sites
26) Top Private Equity sites
27) Top Islamic Finance sites
28) Top Economics data sites
29) Top Business data sites
30) Top Finance Data sites
31) Top Economics Research sites
32) Top Finance Research sites
33) Top Business Research sites
34) Top Economics job sites
35) Top Finance job sites
36) Top Business job sites
37) Top Personal Finance sites

BusinessEconomics.com specializes in providing students, University lecturers and professionals working in the areas of Business, Economics and Finance with links and reviews of high quality websites that they may find useful in their academic and professional lives. The site and the resources to fund this year’s awards is provided by advertising revenue and some sponsorship of our pages, the details of which are contained in the link below.

Again many congratulations on your award. We feel it is important that websites that provide an excellent user experience, with good educational value and information are recognised. This is the third year of the awards which are already established as the most important in the Business, Economics and Finance categories.

Best wishes
Keith Pilbeam
www.BusinessEconomics.com

Wednesday, December 21, 2016

Housing Construction, Sales Strong, Interest Rates Still Ultra-Low


The Mortgage Corner

Housing starts are being hit by huge swings. November starts fell 18.7 percent in November to a much lower-than-expected 1.090 million annualized rate following an upward revised gain of 27.4 percent to 1.340 million in October, says Econoday. But that’s to be expected with winter weather already hitting the Midwest and eastern states.

This is while interest rates have barely budged since the Fed raised its short term rates 0.25 percent to s range of 0.50 to 0.75 percent. That’s why housing construction and builder sentiment remain strong. The 30-year conforming fixed rate remains below 4 percent--@3.875 percent for one origination point (i.e., one percent) in California.

And existing-home sales are at record highs for this cycle. Existing-home sales ran at a seasonally adjusted annual 5.61 million pace, the National Association of Realtors said Thursday. That was up 0.7 percent from a downwardly-revised pace of 5.57 million in October and marks the highest since February 2007.
Lawrence Yun, NAR chief economist, says it's been an outstanding three-month stretch for the housing market as 2016 nears the finish line. "The healthiest job market since the Great Recession and the anticipation of some buyers to close on a home before mortgage rates accurately rose from their historically low level have combined to drive sales higher in recent months," he said. "Furthermore, it's no coincidence that home shoppers in the Northeast — where price growth has been tame all year — had the most success last month."
November’s existing sales rate was 15.4 percent higher compared to a year ago, the first month when new regulations, known as the “Know Before You Owe”, or TRID disclosures that added extra days to disclosure times went into effect, snarling closing times.

Single-family starts fell 4.1 percent in November to a seasonally adjusted annual rate of 828,000 units while multifamily production dropped 45.1 percent to 262,000 units. However, the best news in the report is a 15.4 percent gain in housing completions to a 1.216 million rate which follows a 6.3 percent jump in the prior month. Houses authorized but not started are also up, 3.0 percent higher to 138,000. Gains here will help ease what is very tight supply for new homes.
 
The Mortgage Corner
 
 “Single-family starts declined from a robust level in October but still remain very solid,” said NAHB Chief Economist Robert Dietz. “Though rising mortgage rates could be a headwind for housing, we expect single-family production to continue on a long-run, gradual growth trend. Meanwhile, the multifamily sector, which has been volatile in recent months, is expected to level off at a solid rate as that market finds balance between supply and demand.”
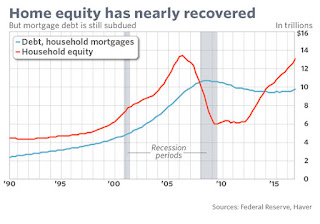
 Rising household wealth is one reason housing sales have returned to 2007 levels, as household net worth rose to a new all-time high and home equity rose to just a hair below its level in 2006, before the housing bubble burst, said the Federal Reserve in its quarterly flow of funds report.
NAR Chief Economist Lawrence Yun believes housing sales could go even higher if housing starts continue to increase. The “big obstacle,” said Yun, is the ongoing “housing shortage,” which is pushing prices to record levels, as well. There were 4.0 months of supply at the current pace of sales, the 18th month in which inventory was tighter compared to its level a year ago.”
 Rising household wealth is one reason housing sales have returned to 2007 levels, as household net worth rose to a new all-time high and home equity rose to just a hair below its level in 2006, before the housing bubble burst, said the Federal Reserve in its quarterly flow of funds report.
But inflation is on the rise, which will boost housing prices further and perhaps encourage more construction, as well. The median existing-home price across the country was $234,900, up 6.8 percent compared to November 2015. This means those with little or no equity in their homes will see their financial position improve, thus adding to future economic growth.

Harlan Green © 2016

Follow Harlan Green on Twitter: https://twitter.com/HarlanGreen

Friday, December 16, 2016

Janet Yellen and The Fed’s Rate Hike(s)

The Mortgage Corner

The Federal Reserve on Wednesday raised a key U.S. interest rate for the first time in a year and signaled a more aggressive approach in 2017—with maybe 2 to 3 more rate increases—if incoming president Donald Trump implements a so-called ‘full-throttle’ strategy to jack up the American economy.

Some economists think the tax cuts and increased spending plans put forward by the Trump team may trigger higher inflation and force the Central Bank to raise rates more aggressively. Others think the Fed may be able to accommodate some stimulus without reacting sharply, said observers of the Fed’s action.

Fed officials did not give many hints in their latest forecast for the economy. They still expect GDP growth to average 2 percent over the next three years, and inflation to be moderate, although the Trump team forecasts 4 percent growth for years to come with their spending plans. The Fed also predicts unemployment will stay close to the 4.6 percent rate seen in November, which would make those growth targets impossible to meet if he sends the 11 million undocumented workers home, as he promised.

But President-Elect Trump has to know that, so he won’t be ejecting all those ‘illegals.’ It’s another con, the same ploy he used with his refusal to retract the Obama birther charge for six years. It brought those white and racist male (and female) voters to his side, which he calculated would outnumber the hostile Hispanic vote.

In fact, inflation is already picking up, even though at the consumer level it remains low. The Consumer Price Index that measures retail prices rose just 0.2 percent in November with the year-on-year rate up 1 tenth to plus 1.7 percent. The core rate, which excludes food and energy, also rose 0.2 percent with its year-on-year unchanged at 2.1 percent, and now at the Fed’s inflation target.


However, this is not enough inflation to generate additional growth. Inflation levels in the Clinton and GW Bush administrations were in the 3 to 4 percent range before 4 percent GDP growth kicked in.

And the Trump economic team must also know higher inflation will come with higher growth projections, since they want to finance much of the stimulus with additional borrowing without raising taxes to support that debt, as the GW Bush administration did to finance its spending for the invasion and occupation of Iraq and Afghanistan.

So Wall Street Economist Greg Ip believes the Trump team’s plans will cause pain. “Donald Trump’s tax cuts would result in $6 trillion in lost revenue over the next decade, according to several independent analyses. His advisers disagree. They claim Mr. Trump’s entire program, including trade, regulation and energy, not just taxes, would generate so much growth there would be almost no increase in the deficit.

But their math doesn’t add up, says Ip. “It rests on aggressive, tenuous or flawed assumptions: that deficits caused by tax cuts don’t raise interest rates; that removing regulations adds directly to gross domestic product; that oil and gas companies will rush to drill on newly opened federal land regardless of energy prices; and that protectionism expands the economy even if U.S. companies and workers are already working flat out.”
We therefore should assume higher inflation will come with more stimulus spending, but that’s not always a bad thing if it creates enough new jobs in an economy already near full employment. But it also means the Fed may keep its promise to raise interest rates further next year.

Harlan Green © 2016

Follow Harlan Green on Twitter: https://twitter.com/HarlanGreen

Monday, December 12, 2016

Trump Voters and The Drug Epidemic

Popular Economics Weekly

Why should so many rust-belt citizens vote for President-Elect Donald Trump, who is patently against the interest of working class voters? I am speaking of his promise to revoke Obamacare, which will make the 20-30 million dependent on it poorer and sicker. And his selection of Oklahoma Attorney General Pruitt to run the EPA, who we know wants to roll back environmental regulations, making everyone warmer, or House Speaker Ryan, who really wants to abolish Medicare as we know it and turn it into a voucher plan.

A recent Penn State study tells us why so many of the poorest and displaced white, blue collar workers voted for him. It was the desperation of depressed families and communities rampant with drug and alcohol abuse, in part from the loss of jobs and the identities that went with holding a decent paying job, who would trust a strong white male with authoritative tendencies who made enough pie-in-the-sky promises more than a female President.

One can say that such desperation leads to an irrational kind of anger, against anything that looks like the old order. Yet it was the old, white male order that created both the Great Recession—because GW Bush’s trickle-down economics cut regulations as well as taxes of the wealthiest, frittering away the budget surpluses of President Clinton’s last 4 years in office—and obstructed a robust recovery by opposing almost any stimulus spending, even shutting down the government in 2011.

The Penn State study showed how hopeless was the situation to the inhabitants now isolated from the modern multi-ethnic, multi-racial, multi-national economy. Most of those industrial, high-paying blue collar jobs are gone, replaced by high tech machines and little effort was made to replace them or rebuild those communities.


The factory sector has been contracting since October 2014, but has recently shown signs of strength. Factory orders surged 2.7 percent in October. Both commercial and defense, were major positives, but the strength was well distributed with the monthly gain excluding all aircraft at a very strong 0.7 percent.
Donald Trump got significantly more votes in areas with high rates of drug addiction, alcohol abuse and suicide, according to the study done by Shannon Monnat, a Penn State researcher who specializes in rural issues.
"I think Trump's anti-free trade message resonated in these places and his rhetoric was very simple -- Make America great again," Monnat said. "And you have to understand that in some of these places that have experienced widespread decline in manufacturing and extraction and the types of jobs that pay livable wages, people there really feel like America is not so great anymore. I think the message that he was the change candidate really resonated with people in these places."
According to Swayne's article, the mortality rate from drugs, alcohol and suicide is 36 deaths per 100,000 people in the least economically distressed parts of the country. The rate is 49 deaths per 100,000 in the most economically distressed areas.

There is now some hope for the rust belt if Trump can carry through on his infrastructure rebuilding promise. After two years in contraction, factory orders year-on-year rates are again positive, at 1.3 percent, and for shipments, at 0.4 percent. October details included a useful 0.4 percent rise in shipments and a 0.7 percent jump in unfilled orders that ended a long run of contraction for this reading.

We hope the factory sector and manufacturing in general can recover in those areas most affected by high addiction rates.  The CDC reported in a 2007 report that more people now die from heroin overdose that gun homicides in those same rust-belt areas. And opioid deaths continued to surge in 2015, surpassing 30,000 for the first time in recent history, according to CDC data released Thursday. That marks an increase of nearly 5,000 deaths from 2014. Deaths involving powerful synthetic opiates, like fentanyl, rose by nearly 75 percent from 2014 to 2015.

Harlan Green © 2016

Follow Harlan Green on Twitter: https://twitter.com/HarlanGreen

Monday, December 5, 2016

Why Are Consumers Happier?

Financial FAQs

Why are consumers much happier during these holidays? The University of Michigan's consumer sentiment index for November jumped 6.6 points to a six-month high while the Conference Board's consumer confidence index jumped 6.3 points to 107.1 for its best reading of the cycle, since July 2007.


It has to be in part the record-low November unemployment rate of 4.6 percent for starters, and rising wages now that minimum wages are rising in major metropolitan areas, as well as whole states like California and Washington. Econoday says the second Q3 GDP growth estimate included a sizable upgrade for consumer spending, up 7 tenths to an annualized and inflation-adjusted 2.8 percent. This is down from the second-quarter's 4.3 percent rate but the average of these two is the best in nearly two years.


It’s in the service sector that employment is growing fastest. In another sign of strength for the economy, the ISM non-manufacturing index jumped 2.4 points in November to a 57.2 reading that tops most forecasts.

Employment for the ISM survey, where growth was soft in October, shot more than 5 points higher to an outsized 58.2. Averaging recent scores for this reading puts the trend at a softer but still very respectable mid-50s rate. New orders are very strong, at 57.0, with export orders also at 57.0 in a reminder of the importance of foreign demand for the nation's service sector. Business activity is a highlight of November's report at 6l.7.

This is one reason boosting minimum wages is so important. Most jobs are being created in the lower-paying service sector, which now employs some 80 percent of workers, and has been a major reason for the tepid 2 percent growth rate average of the economy since the end of the Great Recession.

Manufacturing has been hit hardest, and there is some doubt that Prez-elect Trump will be able to fulfill his promise to bring manufacturing jobs back that were lost. So we will have to rely on the non-manufacturing industries listed below for future growth in jobs and wages.
“The 14 non-manufacturing industries reporting growth in November in the survey said Anthony Nieves, CPSM, C.P.M., CFPM, chair of the Institute for Supply Management® (ISM®) Non-Manufacturing Business Survey Committee. — listed in order — are: Agriculture, Forestry, Fishing & Hunting; Retail Trade; Arts, Entertainment & Recreation; Transportation & Warehousing; Other Services; Management of Companies & Support Services; Construction; Finance & Insurance; Professional, Scientific & Technical Services; Accommodation & Food Services; Information; Health Care & Social Assistance; Wholesale Trade; and Mining. The two industries reporting contraction in November are: Real Estate, Rental & Leasing; and Public Administration.”
That’s why economists and the Fed believe it is more important to look at the personal income and consumption expenditure figures in such as the Econoday graph above to know where future growth in incomes (and higher demand) will come from.

Harlan Green © 2016

Follow Harlan Green on Twitter: https://twitter.com/HarlanGreen

Saturday, December 3, 2016

4.6% Unemployment--178,000 Payroll Jobs In November

Popular Economics Weekly

Nonfarm payrolls rose 178,000 in November to just beat out expectations with revisions no factor, says Econoday. A sharp downward revision to October, now at 142,000, was offset by a nearly as sharp upward revision to September, now at 208,000. And the unemployment rate fell a very sharp 3 tenths to 4.6 percent for the lowest reading in nine years, since August 2007.


But the dip in the unemployment rate is tied, not to greater growth in employment, but to a dip in the participation rate, down 1 tenth to 62.7 percent, and drop in the labor force of 226,000 (I.e., that many quit or stopped looking for work.)

And a headline negative in the report is a slight drop of 0.1 percent decline in average hourly earnings, the first negative reading of the year and more than reversing October's very strong 0.4 percent gain and driving down the year-on-year rate from a cycle high of 2.8 percent back down to 2.5 percent where it last was in August. But Wrightson-ICAP believes this was due to a shorter work month, whereas December’s longer month will probably boost it up to 3.0 percent.

Payrolls growth was led in November by another major gain for professional & services, up 63,000, and a 14,000 gain for the temporary help subcomponent. Gains in these readings point to demand for short-term labor in lieu of finding full-time labor. Construction is another positive, up 19,000 and reflecting strength in residential building. Construction over the past 3 months added 59,000 jobs, largely in residential construction.

This highlights the boost in new-home construction I wrote about in an earlier column. Housing starts surged 25.5 percent in October to a 1.323 million annualized rate. This is the best rate of the cycle since August 2007 with the monthly percentage gain the strongest since 1982. It and other recent good news, such as much higher retail sales, could mean something like a 4 percent GDP growth rate in Q4 this year.

As a side note, housing construction is booming because housing prices are accelerating, according to Zillow and the S&P Housing Price Index. The September Case-Shiller national index is expected to grow 5.7 percent year-over-year and 0.8 percent month-to-month (seasonally adjusted), even with the pace of monthly growth and up from 5.5 percent annual growth pace set in September.


And in the payrolls report, the so-called U-6 component of those that work part time but want to work fulltime declined to 5.7 million, the lowest total since 2008. And governments also added 22,000 payroll jobs, another sign of hiring strength, as governments haven’t yet made the 700,000 jobs lost in the Great Recession.

A negative is an 8,000 decline in retail which indicates that retailers are not gearing up much for the holidays. But that may be because of higher online retail sales. Thus far in 2016, employment growth has averaged 180,000 per month, compared with an average monthly increase of 229,000 in 2015.

The pundits are saying we now can expect the Fed to raise their short term rates at least 0.25 percent this month. Stay tuned for their next and last FOMC meeting this year, on December 13-14, or it may even be sooner, in the coming week?

Harlan Green © 2016

Follow Harlan Green on Twitter: https://twitter.com/HarlanGreen